Demographics of the Faroe Islands
This article is about the demographic features of the population of the Faroe Islands, including population density, ethnicity, education level, health of the populace, economic status, religious affiliations and other aspects of the population.
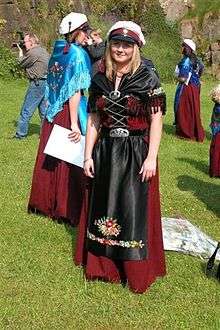
The vast majority of the population are ethnic Faroese, of North Germanic descent. Ethnic Faroese are, in genetic terms, among the most homogenous groups ever found.
Recent DNA analysis have revealed that Y chromosomes, tracing male descent, are 87% Scandinavian.[1] The studies show that mitochondrial DNA, tracing female descent, is 84% Scottish / Irish.[2]
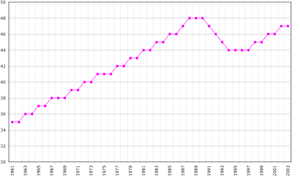
Of the approximately 48,000 inhabitants of the Faroe Islands (16,921 private households (2004)), 98% are Danish realm citizens, meaning Faroese, Danish, or Greenlandic. By birthplace one can derive the following origins of the inhabitants: born on the Faroes 91.7%, in Denmark 5.8%, and in Greenland 0.3%. The largest group of foreigners are Icelanders comprising 0.4% of the population, followed by Norwegians and Poles, each comprising 0.2%. Altogether, on the Faroe Islands there are people from 77 different nationalities. The Faroe Islands have the highest rate of adoption in the world, despite a relatively high fertility rate of 2.6 children.
Faroese is spoken in the entire country as a first language. It is not possible to say exactly how many people worldwide speak the Faroese language.
The 2011 census, called Manntal, shows that 10% were not born in the Faroe Islands, but of these only 3% were born outside the Kingdom of Denmark. 6.5% of people older than 15 did not speak Faroese as their mother tongue. 33 persons said that they did not understand Faroese at all.[3] According to the 2011 census, 45 361 Faroese people (people living in the Faroes) spoke Faroese as their first language and 1546 spoke Danish as their first language.
The Faroese language is one of the smallest of the Germanic languages. It is most similar to Icelandic and Norwegian. In the twentieth century Faroese became the official language and since the Faroes are a part of the Danish realm Danish is taught in schools as a compulsory second language.
Faroese language policy provides for the active creation of new terms in Faroese suitable for modern life.
Vital statistics since 1900 [4][5]
| Average population | Live births | Deaths | Natural change | Crude birth rate (per 1000) | Crude death rate (per 1000) | Natural change (per 1000) | |
|---|---|---|---|---|---|---|---|
| 1900 | 15 000 | 455 | 233 | 222 | 30.3 | 15.5 | 14.8 |
| 1901 | 15 300 | 457 | 228 | 229 | 29.9 | 14.9 | 15.0 |
| 1902 | 15 600 | 502 | 217 | 285 | 32.2 | 13.9 | 18.3 |
| 1903 | 15 900 | 435 | 199 | 236 | 27.4 | 12.5 | 14.8 |
| 1904 | 16 200 | 489 | 234 | 255 | 30.2 | 14.4 | 15.7 |
| 1905 | 16 500 | 498 | 296 | 202 | 30.2 | 17.9 | 12.2 |
| 1906 | 16 700 | 493 | 229 | 264 | 29.5 | 13.7 | 15.8 |
| 1907 | 17 000 | 479 | 196 | 283 | 28.2 | 11.5 | 16.6 |
| 1908 | 17 300 | 576 | 182 | 394 | 33.3 | 10.5 | 22.8 |
| 1909 | 17 600 | 528 | 196 | 332 | 30.0 | 11.1 | 18.9 |
| 1910 | 17 900 | 576 | 157 | 419 | 32.2 | 8.8 | 23.4 |
| 1911 | 18 200 | 559 | 164 | 395 | 30.7 | 9.0 | 21.7 |
| 1912 | 18 600 | 624 | 184 | 440 | 33.5 | 9.9 | 23.7 |
| 1913 | 18 900 | 650 | 169 | 481 | 34.4 | 8.9 | 25.4 |
| 1914 | 19 200 | 580 | 182 | 398 | 30.2 | 9.5 | 20.7 |
| 1915 | 19 600 | 643 | 288 | 355 | 32.8 | 14.7 | 18.1 |
| 1916 | 19 900 | 636 | 261 | 375 | 32.0 | 13.1 | 18.8 |
| 1917 | 20 200 | 570 | 240 | 330 | 28.2 | 11.9 | 16.3 |
| 1918 | 20 600 | 625 | 199 | 426 | 30.3 | 9.7 | 20.7 |
| 1919 | 20 900 | 607 | 221 | 386 | 29.0 | 10.6 | 18.5 |
| 1920 | 21 200 | 665 | 227 | 438 | 31.4 | 10.7 | 20.7 |
| 1921 | 21 500 | 614 | 230 | 384 | 28.6 | 10.7 | 17.9 |
| 1922 | 21 800 | 668 | 211 | 457 | 30.6 | 9.7 | 21.0 |
| 1923 | 22 100 | 652 | 255 | 397 | 29.5 | 11.5 | 18.0 |
| 1924 | 22 400 | 631 | 268 | 363 | 28.2 | 12.0 | 16.2 |
| 1925 | 22 700 | 599 | 228 | 371 | 26.4 | 10.0 | 16.3 |
| 1926 | 23 000 | 592 | 199 | 393 | 25.7 | 8.7 | 17.1 |
| 1927 | 23 300 | 579 | 157 | 422 | 24.8 | 6.7 | 18.1 |
| 1928 | 23 600 | 620 | 194 | 426 | 26.3 | 8.2 | 18.1 |
| 1929 | 23 900 | 575 | 253 | 322 | 24.1 | 10.6 | 13.5 |
| 1930 | 24 200 | 633 | 273 | 360 | 26.2 | 11.3 | 14.9 |
| 1931 | 24 500 | 607 | 239 | 368 | 24.8 | 9.8 | 15.0 |
| 1932 | 24 700 | 604 | 210 | 394 | 24.5 | 8.5 | 16.0 |
| 1933 | 25 000 | 545 | 248 | 297 | 21.8 | 9.9 | 11.9 |
| 1934 | 25 300 | 578 | 231 | 347 | 22.8 | 9.1 | 13.7 |
| 1935 | 25 600 | 585 | 269 | 316 | 22.9 | 10.5 | 12.3 |
| 1936 | 25 900 | 565 | 265 | 300 | 21.8 | 10.2 | 11.6 |
| 1937 | 26 200 | 615 | 212 | 403 | 23.5 | 8.1 | 15.4 |
| 1938 | 26 600 | 617 | 241 | 376 | 23.2 | 9.1 | 14.1 |
| 1939 | 26 900 | 577 | 182 | 395 | 21.4 | 6.8 | 14.7 |
| 1940 | 27 300 | 698 | 228 | 470 | 25.6 | 8.4 | 17.2 |
| 1941 | 27 600 | 690 | 286 | 404 | 25.0 | 10.4 | 14.6 |
| 1942 | 28 000 | 721 | 250 | 471 | 25.8 | 8.9 | 16.8 |
| 1943 | 28 300 | 804 | 235 | 569 | 28.4 | 8.3 | 20.1 |
| 1944 | 28 700 | 732 | 247 | 485 | 25.5 | 8.6 | 16.9 |
| 1945 | 29 000 | 718 | 247 | 471 | 24.8 | 8.5 | 16.2 |
| 1946 | 29 000 | 708 | 248 | 460 | 24.4 | 8.6 | 15.9 |
| 1947 | 30 000 | 742 | 242 | 500 | 24.7 | 8.1 | 16.7 |
| 1948 | 30 000 | 821 | 227 | 595 | 27.4 | 7.6 | 19.8 |
| 1949 | 31 000 | 876 | 256 | 626 | 28.3 | 8.3 | 20.2 |
| 1950 | 31 000 | 856 | 282 | 585 | 27.6 | 9.1 | 18.9 |
| 1951 | 31 000 | 857 | 229 | 628 | 27.6 | 7.4 | 20.3 |
| 1952 | 32 000 | 809 | 240 | 569 | 25.3 | 7.5 | 17.8 |
| 1953 | 33 000 | 758 | 228 | 530 | 23.0 | 6.9 | 16.1 |
| 1954 | 33 000 | 757 | 248 | 509 | 22.9 | 7.5 | 15.4 |
| 1955 | 32 000 | 749 | 221 | 528 | 23.4 | 6.9 | 16.5 |
| 1956 | 33 000 | 767 | 239 | 528 | 23.2 | 7.2 | 16.0 |
| 1957 | 33 000 | 746 | 268 | 478 | 22.6 | 8.1 | 14.5 |
| 1958 | 34 000 | 845 | 226 | 619 | 24.9 | 6.6 | 18.2 |
| 1959 | 34 000 | 856 | 242 | 614 | 25.2 | 7.1 | 18.1 |
| 1960 | 34 000 | 764 | 274 | 490 | 22.5 | 8.1 | 14.4 |
| 1961 | 35 000 | 781 | 206 | 575 | 22.3 | 5.9 | 16.4 |
| 1962 | 36 000 | 800 | 234 | 566 | 22.2 | 6.5 | 15.7 |
| 1963 | 36 000 | 848 | 242 | 606 | 23.6 | 6.7 | 16.8 |
| 1964 | 36 000 | 857 | 253 | 604 | 23.8 | 7.0 | 16.8 |
| 1965 | 37 000 | 889 | 261 | 628 | 24.0 | 7.1 | 17.0 |
| 1966 | 37 000 | 969 | 262 | 707 | 26.2 | 7.1 | 19.1 |
| 1967 | 38 000 | 956 | 289 | 667 | 25.2 | 7.6 | 17.6 |
| 1968 | 38 000 | 878 | 262 | 616 | 23.1 | 6.9 | 16.2 |
| 1969 | 38 300 | 843 | 269 | 574 | 22.0 | 7.0 | 15.0 |
| 1970 | 38 700 | 814 | 287 | 527 | 21.0 | 7.4 | 13.6 |
| 1971 | 38 700 | 779 | 308 | 471 | 20.1 | 8.0 | 12.2 |
| 1972 | 38 900 | 798 | 267 | 531 | 20.5 | 6.9 | 13.7 |
| 1973 | 39 400 | 808 | 303 | 505 | 20.5 | 7.7 | 12.8 |
| 1974 | 40 100 | 798 | 303 | 495 | 19.9 | 7.6 | 12.3 |
| 1975 | 40 800 | 781 | 280 | 501 | 19.1 | 6.9 | 12.3 |
| 1976 | 41 300 | 756 | 291 | 465 | 18.3 | 7.0 | 11.3 |
| 1977 | 41 800 | 759 | 271 | 488 | 18.2 | 6.5 | 11.7 |
| 1978 | 42 400 | 742 | 303 | 439 | 17.5 | 7.1 | 10.4 |
| 1979 | 43 000 | 790 | 269 | 521 | 18.4 | 6.3 | 12.1 |
| 1980 | 43 400 | 741 | 309 | 432 | 17.1 | 7.1 | 10.0 |
| 1981 | 43 800 | 753 | 293 | 460 | 17.2 | 6.7 | 10.5 |
| 1982 | 44 200 | 726 | 316 | 410 | 16.4 | 7.1 | 9.3 |
| 1983 | 44 500 | 688 | 361 | 327 | 15.5 | 8.1 | 7.3 |
| 1984 | 45 000 | 695 | 350 | 345 | 15.4 | 7.8 | 7.7 |
| 1985 | 45 500 | 760 | 342 | 418 | 16.7 | 7.5 | 9.2 |
| 1986 | 46 000 | 794 | 371 | 423 | 17.3 | 8.1 | 9.2 |
| 1987 | 46 600 | 785 | 377 | 408 | 16.8 | 8.1 | 8.8 |
| 1988 | 47 300 | 880 | 426 | 454 | 18.6 | 9.0 | 9.6 |
| 1989 | 47 700 | 946 | 375 | 571 | 19.8 | 7.9 | 12.0 |
| 1990 | 47 600 | 955 | 359 | 596 | 20.1 | 7.5 | 12.5 |
| 1991 | 47 400 | 873 | 397 | 476 | 18.4 | 8.4 | 10.0 |
| 1992 | 47 100 | 811 | 401 | 410 | 17.2 | 8.5 | 8.7 |
| 1993 | 46 100 | 771 | 380 | 391 | 16.7 | 8.2 | 8.5 |
| 1994 | 44 500 | 670 | 354 | 316 | 15.1 | 8.0 | 7.1 |
| 1995 | 43 600 | 641 | 363 | 278 | 14.7 | 8.3 | 6.4 |
| 1996 | 43 600 | 673 | 396 | 277 | 15.4 | 9.1 | 6.4 |
| 1997 | 44 000 | 663 | 376 | 287 | 15.1 | 8.5 | 6.5 |
| 1998 | 44 500 | 625 | 377 | 248 | 14.0 | 8.5 | 5.6 |
| 1999 | 45 100 | 626 | 401 | 225 | 13.9 | 8.9 | 5.0 |
| 2000 | 46 022 | 692 | 352 | 340 | 15.1 | 7.7 | 7.4 |
| 2001 | 46 867 | 632 | 358 | 274 | 13.6 | 7.7 | 5.9 |
| 2002 | 47 558 | 709 | 392 | 317 | 15.0 | 8.3 | 6.7 |
| 2003 | 48 118 | 705 | 404 | 301 | 14.7 | 8.4 | 6.3 |
| 2004 | 48 301 | 713 | 379 | 334 | 14.8 | 7.8 | 6.9 |
| 2005 | 48 106 | 712 | 419 | 293 | 14.7 | 8.7 | 6.1 |
| 2006 | 48 269 | 662 | 416 | 246 | 13.7 | 8.6 | 5.1 |
| 2007 | 48 311 | 672 | 380 | 292 | 13.9 | 7.9 | 6.0 |
| 2008 | 48 637 | 661 | 373 | 288 | 13.6 | 7.7 | 5.9 |
| 2009 | 48 530 | 598 | 386 | 212 | 12.3 | 7.9 | 4.4 |
| 2010 | 48 489 | 639 | 348 | 291 | 13.2 | 7.2 | 6.0 |
| 2011 | 48 256 | 576 | 371 | 207 | 12.0 | 7.7 | 4.3 |
| 2012 | 48 051 | 619 | 406 | 210 | 12.8 | 8.4 | 4.4 |
| 2013 | 48 126 | 628 | 364 | 260 | 13.0 | 7.6 | 5.4 |
| 2014 | 48 660 | 639 | 392 | 246 | 13.1 | 8.0 | 5.1 |
| 2015 | 49 975 | 608 | 377 | 231 | 12.4 | 7.7 | 4.7 |
CIA World Factbook demographic statistics
The following demographic statistics are from the CIA World Factbook, unless otherwise indicated.
Age structure
0-14 years:
21% (male 5,362; female 4,975)
15-64 years:
64.2% (male 16,837; female 14,788)
65 years and over:
14,8% (male 3,487; female 3,818) (2011 est.)
Sex ratio
at birth:
1.07 male(s)/female
under 15 years:
1.08 male(s)/female
15-64 years:
1.13 male(s)/female
65 years and over:
0.93 male(s)/female
total population:
1.09 male(s)/female (2012 est.)
Infant mortality rate
5.94 deaths/1,000 live births (2012 est.)
Life expectancy at birth
total population:
79.85 years
male:
77.37 years
female:
82.50 years (2012 est.)
Total fertility rate
2.4 children born/woman (2012 est.)
Nationality
noun:
Faroese (singular and plural)
adjective:
Faroese
Ethnic groups
Faroese (mixed Scandinavian - Scottish)
Religions
Norse Paganism
Languages
The official languages are Faroese (derived from Old Norse), and Danish
People in the Faroe Islands by language in 2011 according to the Faroese census of 2011, named Manntal
Number of all residents of the Faroe Islands who were asked to reply to the questions from Manntal in November 2011: 48.346[6]
- Faroese: 45.361
- Danish 1.546
- Other Scandinavian languages, including Icelandic: 411
- Other European languages: 607
- Asian languages: 290
- Languages from the Middle East and North Africa: 40
- Other African languages: 31
- Sign language:18
- No language: 41
Literacy
definition:
NA
total population:
NA%
male:
NA%
female:
NA%
note:
similar to Denmark proper
Population by island
| Name | Area | Inhabitants | People per km² | Main places | Regions |
|---|---|---|---|---|---|
| Streymoy | 373.5 | 21,717 | 57.4 | Tórshavn and Vestmanna | Tórshavn and rest of Streymoy |
| Eysturoy | 286.3 | 10,738 | 37.5 | Fuglafjørður and Runavík | North Eysturoy and South Eysturoy |
| Vágar | 177.6 | 2,856 | 15.7 | Míðvágur and Sørvágur | Vágar |
| Suðuroy | 166 | 5,074 | 30.9 | Tvøroyri and Vágur | Suðuroy |
| Sandoy | 112.1 | 1,428 | 12.4 | Sandur and Skopun | Sandoy |
| Borðoy | 95 | 5,030 | 52.4 | Klaksvík | Klaksvík and rest of northern Faroes (Norðoyar) |
| Viðoy | 41 | 605 | 15 | Viðareiði | Norðoyar |
| Kunoy | 35.5 | 135 | 3.8 | Kunoy | Norðoyar |
| Kalsoy | 30.9 | 136 | 4.8 | Mikladalur and Húsar | Norðoyar |
| Svínoy | 27.4 | 58 | 2.7 | Svínoy | Norðoyar |
| Fugloy | 11.2 | 46 | 4 | Kirkja | Norðoyar |
| Nólsoy | 10.3 | 262 | 26.1 | Nólsoy | Streymoy |
| Mykines | 10.3 | 19 | 1.8 | Mykines | Vágar |
| Skúvoy | 10 | 61 | 5.7 | Skúvoy | Sandoy |
| Hestur | 6.1 | 40 | 7.1 | Hestur | Streymoy |
| Stóra Dímun | 2.7 | 7 | 1.9 | Dímun | Sandoy |
| Koltur | 2.5 | 2 | 0.8 | Koltur | Streymoy |
| Lítla Dímun | 0.8 | 0 | 0 | – | Suðuroy |
See also
References
- ↑ The origin of the isolated population of the Faroe Islands investigated using Y chromosomal markers, http://www.springerlink.com/content/4yuhf5m7a22gc4qm/, Tove H. Jorgensen, Henriette N. Buttenschön, August G. Wang, Thomas D. Als, Anders D. Børglum and Henrik Ewald1, 8 April 2004.
- ↑ Wang, C. August. 2006. Ílegur og Føroya Søga. In: Frøði pp.20-23
- ↑ Sandportal.fo
- ↑ Statistical yearbooks of Denmark
- ↑ Statistics Faroe Islands
- ↑ hagstova.fo - Faroese people by mother tongue