United States presidential election in Indiana, 2012
| | ||||||||||||||||||||||||||||||||
| ||||||||||||||||||||||||||||||||
| ||||||||||||||||||||||||||||||||
|
| ||||||||||||||||||||||||||||||||
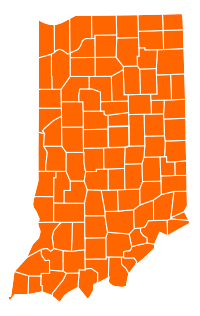
| County Results
Obama—60-70%
Obama—50-60%
Obama—<50%
Romney—50-60%
Romney—60-70%
Romney—70-80% | ||||||||||||||||||||||||||||||||
| ||||||||||||||||||||||||||||||||
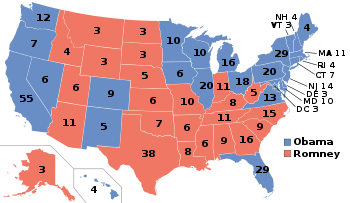
The 2012 United States presidential election in Indiana took place on November 6, 2012 as part of the 2012 General Election in which all 50 states plus The District of Columbia participated. Indiana voters chose 11 electors to represent them in the Electoral College via a popular vote pitting incumbent Democratic President Barack Obama and his running mate, Vice President Joe Biden, against Republican challenger and former Massachusetts Governor Mitt Romney and his running mate, Congressman Paul Ryan. Romney and Ryan carried Indiana with 54.1% of the popular vote to Obama's and Biden's 43.9%, thus winning the state's 11 electoral votes.[1]
Indiana was one of just two states (along with North Carolina) which had been won by Obama in 2008 but which flipped to the Republicans in 2012. Although the state normally leans Republican, in 2008 Obama had been the first Democrat to win Indiana since 1964, albeit by a narrow 1.03% margin. However, unlike North Carolina, Indiana was not seriously contested again by the Obama campaign in 2012, and consequently Romney was able to carry it by a relatively comfortable 10.20%.
Obama also won in Vigo County, home to Terre Haute and a noted bellwether; it has voted for the winner of every presidential election all but twice since 1892.
Campaign
Incumbent Obama didn't visit Indiana although first lady Michelle Obama, Vice President Joe Biden and former President Bill Clinton stumped in the state. Meanwhile, the Romney campaign sensed victory in the state, and he visited Indiana several times.[2]
General Election
Results
| United States presidential election in Indiana, 2012[3] | ||||||
|---|---|---|---|---|---|---|
| Party | Candidate | Running mate | Votes | Percentage | Electoral votes | |
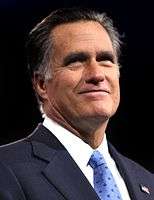
| Republican | Mitt Romney | Paul Ryan | 1,420,543 | 54.13% | 11 | |
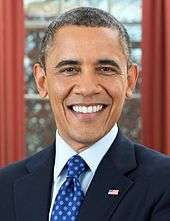
| Democratic | Barack Obama | Joe Biden | 1,152,887 | 43.93% | 0 | |
| Libertarian | Gary Johnson | Jim Gray | 50,111 | 1.91% | 0 | |
| Green (Write-in) | Jill Stein (Write-in) | Cheri Honkala | 625 | 0.02% | 0 | |
| Constitution (Write-in) | Virgil Goode (Write-in) | Jim Clymer | 290 | 0.01% | 0 | |
| America's Party (Write-in) | Thomas Hoefling (Write-in) | Jonathan D. Ellis | 35 | 0.00% | 0 | |
| Socialist (Write-in) | Stewart Alexander (Write-in) | Alex Mendoza | 17 | 0.00% | 0 | |
| Write-Ins | Write-Ins | 10 | 0.00% | 0 | ||
| Unaffiliated (Write-in) | Jill Ann Reed (Write-in) | Tom Cary | 8 | 0.00% | 0 | |
| Independent (Write-in) | Randall Terry (Write-in) | Missy Smith | 8 | 0.00% | 0 | |
| Totals | 2,624,534 | 100.00% | 11 | |||
| Elections in Indiana | ||||||||||
|---|---|---|---|---|---|---|---|---|---|---|
 | ||||||||||
|
||||||||||
Following Romney's win in Indiana, The Indianapolis Star said that "Voters painted Indiana bright red on Tuesday- with a splash or so of blue" and that "voters also proved that while this state is conservative, it doesn't like to stray too far from the middle".[4]
The following people were delegate electors for Romney-Ryan in the Indiana Republican Party:
- Charles Williams, of Valparaiso
- William Ruppel, of North Manchester
- Steve Shine, of Fort Wayne
- Beverly Bush, of Kirklin
- Kyle Hupfer, of Pendleton
- Susan Lightle, of Greenfield
- Pearl Swanigan, of Indianapolis
- William Springer, of Sullivan
- Jamey Noel, of Jeffersonville
- Robert Grand, of Indianapolis
- Eric Holcomb, of Indianapolis
By County
| County | Obama,
Barack Joe Biden (Democratic) |
Romney,
Mitt Paul Ryan (Republican) |
Turnout |
|---|---|---|---|
| Total: | 1152887 | 1420543 | 58% |
| Adams | 3806 | 8937 | 70% |
| Allen | 60036 | 84613 | 58% |
| Bartholomew | 10625 | 18083 | 57% |
| Benton | 1159 | 2329 | 62% |
| Blackford | 1927 | 2711 | 54% |
| Boone | 8328 | 18808 | 65% |
| Brown | 3060 | 4332 | 62% |
| Carroll | 2635 | 4999 | 58% |
| Cass | 5371 | 8443 | 65% |
| Clark | 20807 | 25450 | 54% |
| Clay | 3460 | 7096 | 58% |
| Clinton | 3308 | 6338 | 49% |
| Crawford | 2041 | 2421 | 51% |
| Daviess | 2437 | 7638 | 54% |
| Dearborn | 6528 | 15394 | 60% |
| Decatur | 2941 | 7119 | 67% |
| DeKalb | 5419 | 10587 | 57% |
| Delaware | 22654 | 21251 | 51% |
| Dubois | 6522 | 11654 | 63% |
| Elkhart | 24399 | 42378 | 54% |
| Fayette | 3555 | 5045 | 52% |
| Floyd | 14812 | 19878 | 63% |
| Fountain | 2237 | 4664 | 59% |
| Franklin | 2909 | 7424 | 57% |
| Fulton | 2621 | 5317 | 62% |
| Gibson | 4928 | 9487 | 64% |
| Grant | 9589 | 15151 | 51% |
| Greene | 4350 | 8457 | 64% |
| Hamilton | 43796 | 90747 | 68% |
| Hancock | 9319 | 22796 | 63% |
| Harrison | 6607 | 10640 | 59% |
| Hendricks | 21112 | 44312 | 66% |
| Henry | 7613 | 10838 | 63% |
| Howard | 15135 | 20327 | 59% |
| Huntington | 4596 | 10862 | 63% |
| Jackson | 5838 | 10419 | 57% |
| Jasper | 4672 | 7955 | 59% |
| Jay | 3063 | 4645 | 65% |
| Jefferson | 5728 | 7096 | 60% |
| Jennings | 3821 | 6120 | 58% |
| Johnson | 17260 | 39513 | 60% |
| Knox | 5228 | 9612 | 56% |
| Kosciusko | 6862 | 22558 | 61% |
| La Porte | 24107 | 18615 | 55% |
| LaGrange | 2898 | 6231 | 59% |
| Lake | 130897 | 68431 | 60% |
| Lawrence | 5779 | 11622 | 57% |
| Madison | 24407 | 26769 | 56% |
| Marion | 216336 | 136509 | 56% |
| Marshall | 6137 | 11260 | 61% |
| Martin | 1351 | 3262 | 62% |
| Miami | 4222 | 8174 | 57% |
| Monroe | 33436 | 22481 | 55% |
| Montgomery | 4271 | 9824 | 60% |
| Morgan | 7969 | 19591 | 60% |
| Newton | 2212 | 3291 | 52% |
| Noble | 5229 | 10680 | 56% |
| Ohio | 994 | 1759 | 63% |
| Orange | 2939 | 4617 | 51% |
| Owen | 2823 | 5062 | 55% |
| Parke | 2110 | 4234 | 53% |
| Perry | 4316 | 3403 | 62% |
| Pike | 2125 | 3627 | 64% |
| Porter | 37252 | 34406 | 64% |
| Posey | 4533 | 7430 | 65% |
| Pulaski | 1899 | 3366 | 58% |
| Putnam | 4507 | 9005 | 59% |
| Randolph | 3769 | 6218 | 59% |
| Ripley | 3241 | 7484 | 53% |
| Rush | 2221 | 4633 | 59% |
| Scott | 3998 | 4539 | 46% |
| Shelby | 5359 | 10978 | 61% |
| Spencer | 4026 | 5515 | 63% |
| St. Joseph | 56460 | 52578 | 54% |
| Starke | 3809 | 4738 | 51% |
| Steuben | 4853 | 8547 | 66% |
| Sullivan | 3191 | 4902 | 58% |
| Switzerland | 1437 | 1872 | 50% |
| Tippecanoe | 26711 | 28757 | 54% |
| Tipton | 2432 | 4773 | 57% |
| Union | 1018 | 2022 | 53% |
| Vanderburgh | 31725 | 39389 | 51% |
| Vermillion | 2979 | 3426 | 59% |
| Vigo | 19712 | 19369 | 53% |
| Wabash | 3973 | 8644 | 58% |
| Warren | 1324 | 2377 | 58% |
| Warrick | 8793 | 15351 | 49% |
| Washington | 3909 | 6533 | 56% |
| Wayne | 10591 | 14321 | 58% |
| Wells | 3436 | 9256 | 71% |
| White | 3637 | 5970 | 57% |
| Whitley | 4420 | 10258 | 69% |
Democratic primary
No major Democratic candidate challenged President Obama for the Democratic nomination in 2012. [Data unknown/missing. You can help!]
Republican primary
| | |||||||||||||||||||||||||||||||||||||||||||||||
| |||||||||||||||||||||||||||||||||||||||||||||||
| |||||||||||||||||||||||||||||||||||||||||||||||
|
| |||||||||||||||||||||||||||||||||||||||||||||||
| Indiana results by county
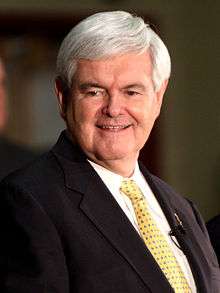
Mitt Romney
(Note: Italicization indicates a withdrawn candidacy) | |||||||||||||||||||||||||||||||||||||||||||||||
The Republican primary took place on May 8, 2012.[5][6]
| Indiana Republican primary, 2012[7] | |||||||
|---|---|---|---|---|---|---|---|
| Candidate | Votes | Percentage | Projected delegate count | ||||
| AP | CNN |
FOX | |||||
| |
410,635 | 64.61% | 28 | 27 | |||
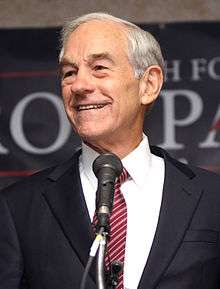
| Ron Paul | 98,487 | 15.50% | |||||
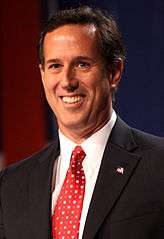
| Rick Santorum (withdrawn) | 85,332 | 13.43% | |||||
| Newt Gingrich (withdrawn) | 41,135 | 6.47% | |||||
| Unprojected delegates: | 18 | 19 | 46 | ||||
| Total: | 635,589 | 100.00% | 46 | 46 | 46 | ||
See also
- Republican Party presidential debates, 2012
- Republican Party presidential primaries, 2012
- Results of the 2012 Republican Party presidential primaries
- United States Senate election in Indiana, 2012
References
- ↑ "2012 Presidential Election - Indiana". Politico. Retrieved 22 November 2012.
- ↑ "Hoosiers go for Romney; Obama fails to repeat his narrow win here in '08". The Indianapolis Star. Retrieved November 8, 2012.
- ↑ http://www.uselectionatlas.org/RESULTS/state.php?year=2012&fips=18&f=0&off=0&elect=0&minper=0
- ↑ "Analysis: Hoosiers back Republicans but want them in the middle". The Indianapolis Star. Retrieved November 8, 2012.
- ↑ "Primary and Caucus Printable Calendar". CNN. Retrieved January 11, 2012.
- ↑ "Presidential Primary Dates" (PDF). Federal Election Commission. Retrieved January 23, 2012.
- ↑ Secretary of State election results. June 5, 2012. Retrieved June 27, 2012.
http://www.indiana.gov/sos/elections/files/2012_Presidential_Elector_Candidate_List.pdf
External links
- The Green Papers: for Indiana
- The Green Papers: Major state elections in chronological order
