Results of the Democratic Party presidential primaries, 2016
Democratic Party presidential primaries, 2016
.svg.png)
|
| February 1 – June 14, 2016 |
|
|
|
|
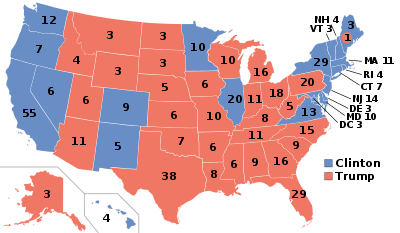
First place by first-instance vote
|
Hillary Clinton (34)
Bernie Sanders (23)
|
|
|
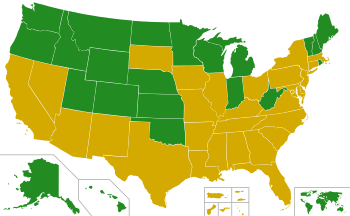
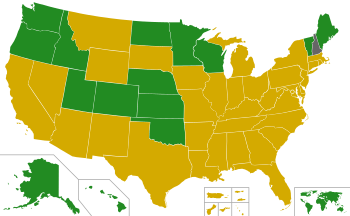
First place finishes by convention roll call
|
Hillary Clinton (40)
Bernie Sanders (16)
Delegate Tie (1)
|
|
|
| |
This article includes the entire 2016 Democratic Party presidential primary schedule in a format that includes result tabulation. Below are the vote totals for everyone that appeared on the ballot during the 2016 Democratic presidential primaries. Two candidates, Bernie Sanders and Hillary Clinton, appeared on all 57 ballots. Two others, Martin O'Malley and Rocky De La Fuente, appeared in over 30 states and six others appeared on between two and ten states. Nearly 20 appeared on only New Hampshire's ballot. As of June 8, Hillary Clinton was considered the presumptive nominee according to media organizations.[2] On July 26, the second day of the Democratic National Convention, Clinton was confirmed the Democratic nominee for the 2016 United States presidential election.[3]
Overview
.svg.png)

.svg.png)
.svg.png)


Major candidates
The following are the results of candidates that have won at least one state. These candidates are on the ballots for every state, territory, and federal district contest. The results of caucuses do not always have attached preference polls and attendance can be extremely limited. The unpledged delegate count may not always reflect the latest declared preferences. Results are collected by The New York Times.[4] For explanations of the various types of primaries see primary elections in the United States.
| Date |
State/territory |
Calculated delegates |
Type[lower-alpha 2] |
Popular vote or equivalent[lower-alpha 3] |
Estimated delegates[lower-alpha 4] |
| Clinton |
Sanders |
Clinton |
Sanders |
Available[lower-alpha 5] |
| P |
U |
T |
P |
U |
T |
P |
U |
T |
P |
U |
T |
| 000000002016-02-01-0000Feb 1 |
Iowa[5] |
44 | 7 | 51 | c2-sdeSemi-open caucus |
700 SDE (49.8%) |
697 SDE (49.6%) |
23 | 6 | 29 |
21 | 0 | 21 |
0 | 1 | 1 |
| 000000002016-02-09-0000Feb 9 |
New Hampshire[6] |
24 | 8 | 32 | p3Semi-closed primary |
95,355 (37.7%) | 152,193 (60.1%) |
9 | 6 | 15 |
15 | 1 | 16 |
0 | 1 | 1 |
| 000000002016-02-20-0000Feb 20 |
Nevada[7] |
35 | 8 | 43 | c4-cdClosed caucus |
6,316 CD (52.6%) |
5,678 CD (47.3%) |
20 | 7 | 27 |
15 | 1 | 16 |
0 | 0 | 0 |
| 000000002016-02-27-0000Feb 27 |
South Carolina[8] |
53 | 6 | 59 | p1Open primary |
272,379 (73.4%) | 96,498 (26.0%) |
39 | 5 | 44 |
14 | 0 | 14 |
0 | 1 | 1 |
| 000000002016-03-01-0000Mar 1 |
Alabama[9] |
53 | 7 | 60 | p1Open primary |
309,926 (77.8%) | 76,401 (19.2%) |
44 | 6 | 50 |
9 | 0 | 9 |
0 | 1 | 1 |
| American Samoa[10] |
6 | 5 | 11 | c4Closed caucus |
162 (68.4%) | 61 (25.7%) |
4 | 4 | 8 |
2 | 1 | 3 |
0 | 0 | 0 |
| Arkansas[11] |
32 | 5 | 37 | p1Open primary |
146,057 (66.1%) | 66,236 (30.0%) |
22 | 5 | 27 |
10 | 0 | 10 |
0 | 0 | 0 |
| Colorado[12] |
66 | 12 | 78 | c4Closed caucus |
49,789 (40.3%) | 72,846 (59.0%) |
25 | 9 | 34 |
41 | 0 | 41 |
0 | 3 | 3 |
| Georgia[13] |
102 | 15 | 117 | p1Open primary |
543,008 (71.3%) | 214,332 (28.2%) |
73 | 11 | 84 |
29 | 0 | 29 |
0 | 4 | 4 |
| Massachusetts[14][15] |
91 | 24 | 115 | p3Semi-closed primary |
606,822 (49.7%) | 589,803 (48.3%) |
46 | 21 | 67 |
45 | 1 | 46 |
0 | 2 | 2 |
| Minnesota[16] |
77 | 16 | 93 | c1Open caucus |
73,510 (38.4%) | 118,135 (61.6%) |
31 | 12 | 43 |
46 | 2 | 48 |
0 | 2 | 2 |
| Oklahoma[17][18] |
38 | 4 | 42 | p3Semi-closed primary |
139,443 (41.5%) | 174,228 (51.9%) |
17 | 1 | 18 |
21 | 1 | 22 |
0 | 2 | 2 |
| Tennessee[19] |
67 | 8 | 75 | p1Open primary |
245,930 (66.1%) | 120,800 (32.5%) |
44 | 8 | 52 |
23 | 0 | 23 |
0 | 0 | 0 |
| Texas[20] |
222 | 29 | 251 | p1Open primary |
936,004 (65.2%) | 476,547 (33.2%) |
147 | 21 | 168 |
75 | 0 | 75 |
0 | 8 | 8 |
| Vermont[21][22] |
16 | 10 | 26 | p1Open primary |
18,338 (13.6%) | 115,900 (85.7%) |
0 | 5 | 5 |
16 | 5 | 21 |
0 | 0 | 0 |
| Virginia[23] |
95 | 13 | 108 | p1Open primary |
504,741 (64.3%) | 276,370 (35.2%) |
62 | 12 | 74 |
33 | 0 | 33 |
0 | 1 | 1 |
| 000000002016-03-05-0000Mar 5 |
Kansas[24] |
33 | 4 | 37 | c4Closed caucus |
12,593 (32.3%) | 26,450 (67.7%) |
10 | 4 | 14 |
23 | 0 | 23 |
0 | 0 | 0 |
| Louisiana[25] |
51 | 8 | 59 | p4Closed primary |
221,733 (71.1%) | 72,276 (23.2%) |
37 | 6 | 43 |
14 | 0 | 14 |
0 | 2 | 2 |
| Nebraska[26] |
25 | 5 | 30 | c4Closed caucus |
14,340 (42.9%) | 19,120 (57.1%) |
10 | 3 | 13 |
15 | 1 | 16 |
0 | 1 | 1 |
| 000000002016-03-06-0000Mar 6 |
Maine[27] |
25 | 5 | 30 | c4-scdClosed caucus |
1,232 SCD (35.5%) | 2,231 SCD (64.3%) |
8 | 4 | 12 |
17 | 1 | 18 |
0 | 0 | 0 |
| 000000002016-03-08-0000Mar 1–8 | Democrats Abroad[28] |
13 | 4[lower-alpha 6] | 17 | p4Closed primary |
10,689 (30.9%) | 23,779 (68.9%) |
4 | 2½ | 6½ |
9 | ½ | 9½ |
0 | 1 | 1 |
| 000000002016-03-08-0000Mar 8 |
Michigan[29][30] |
130 | 17 | 147 | p1Open primary |
581,775 (48.3%) | 598,943 (49.7%) |
63 | 13 | 76 |
67 | 0 | 67 |
0 | 4 | 4 |
| Mississippi[31] |
36 | 5 | 41 | p1Open primary |
187,334 (82.5%) | 37,748 (16.6%) |
31 | 3 | 34 |
5 | 2 | 7 |
0 | 0 | 0 |
| 000000002016-03-12-0000Mar 12 |
Northern Marianas[32] |
6 | 5 | 11 | c4Closed caucus |
102 (54.0%) | 65 (34.4%) |
4 | 5 | 9 |
2 | 0 | 2 |
0 | 0 | 0 |
| 000000002016-03-15-0000Mar 15 |
Florida[33][34] |
214 | 32 | 246 | p4Closed primary |
1,101,414 (64.4%) | 568,839 (33.3%) |
141 | 24 | 165 |
73 | 2 | 75 |
0 | 6 | 6 |
| Illinois[35] |
156 | 27 | 183 | p1Open primary |
1,039,555 (50.6%) | 999,494 (48.6%) |
79 | 24 | 103 |
77 | 1 | 78 |
0 | 1[lower-alpha 5] | 1[lower-alpha 5] |
| Missouri[36] |
71 | 13 | 84 | p1Open primary |
312,285 (49.6%) | 310,711 (49.4%) |
36 | 11 | 47 |
35 | 0 | 35 |
0 | 2 | 2 |
| North Carolina[37] |
107 | 14 | 121 | p3Semi-closed primary |
622,915 (54.5%) | 467,018 (40.9%) |
60 | 9 | 69 |
47 | 2 | 49 |
0 | 3 | 3 |
| Ohio[38][39] |
143 | 17 | 160 | p2Semi-open primary |
696,681 (56.1%) | 535,395 (43.1%) |
81 | 16 | 97 |
62 | 1 | 63 |
0 | 0 | 0 |
| 000000002016-03-22-0000Mar 22 |
Arizona[40][41] |
75 | 10 | 85 | p4Closed primary |
262,459 (56.3%) | 192,962 (41.4%) |
42 | 6 | 48 |
33 | 1 | 34 |
0 | 3 | 3 |
| Idaho[42] |
23 | 4 | 27 | c1Open caucus |
5,065 (21.2%) | 18,640 (78.0%) |
5 | 1 | 6 |
18 | 2 | 20 |
0 | 1 | 1 |
| Utah[43] |
33 | 4 | 37 | c2Semi-open caucus |
15,666 (20.3%) | 61,333 (79.3%) |
6 | 2 | 8 |
27 | 2 | 29 |
0 | 0 | 0 |
| 000000002016-03-26-0000Mar 26 |
Alaska[44][45] |
16 | 4 | 20 | c4Closed caucus |
2,146 (20.2%) | 8,447 (79.6%) |
3 | 1 | 4 |
13 | 1 | 14 |
0 | 2 | 2 |
| Hawaii[46] |
25 | 9 | 34 | c3Semi-closed caucus |
10,125 (30.0%) | 23,530 (69.8%) |
8 | 5 | 13 |
17 | 2 | 19 |
0 | 2 | 2 |
| Washington[47] |
101 | 17 | 118 | c1-scdOpen caucus |
7,140 LDD (27.1%) | 19,159 LDD (72.7%) |
27 | 11 | 38 |
74 | 0 | 74 |
0 | 6 | 6 |
| 000000002016-04-05-0000Apr 5 |
Wisconsin[48][49] |
86 | 10 | 96 | p1Open primary |
433,739 (43.1%) | 570,192 (56.6%) |
38 | 9 | 47 |
48 | 1 | 49 |
0 | 0 | 0 |
| 000000002016-04-09-0000Apr 9 |
Wyoming[50] |
14 | 4 | 18 | c4-scdClosed caucus |
124 SCD (44.3%) | 156 SCD (55.7%) |
7 | 4 | 11 |
7 | 0 | 7 |
0 | 0 | 0 |
| 000000002016-04-19-0000Apr 19 |
New York[51][52][53] |
247 | 44 | 291 | p4Closed primary |
1,133,980 (57.5%) | 820,256 (41.6%) |
139 | 41 | 180 |
108 | 0 | 108 |
0 | 3 | 3 |
| 000000002016-04-26-0000Apr 26 |
Connecticut[54][55] | 55 | 16 | 71 | p4Closed primary |
170,045 (51.8%) | 152,379 (46.4%) |
28 | 15 | 43 |
27 | 0 | 27 |
0 | 1 | 1 |
| Delaware[56][57] |
21 | 11 | 32 | p4Closed primary |
55,954 (59.8%) | 36,662 (39.2%) |
12 | 11 | 23 |
9 | 0 | 9 |
0 | 0 | 0 |
| Maryland[58][59] | 95 | 24 | 119 | p4Closed primary |
573,242 (62.5%) | 309,990 (33.8%) |
60 | 17 | 77 |
35 | 1 | 36 |
0 | 6 | 6 |
| Pennsylvania[60] | 189 | 19 | 208 | p4Closed primary |
935,107 (55.6%) | 731,881 (43.5%) |
106 | 19 | 125 |
83 | 0 | 83 |
0 | 1 | 1 |
| Rhode Island[61][62] |
24 | 9 | 33 | p3Semi-closed primary |
52,749 (43.1%) | 66,993 (54.7%) |
11 | 9 | 20 |
13 | 0 | 13 |
0 | 0 | 0 |
| 000000002016-05-03-0000May 3 |
Indiana[63] |
83 | 9 | 92 | p1Open primary |
303,705 (47.5%) | 335,074 (52.5%) |
39 | 7 | 46 |
44 | 0 | 44 |
0 | 2 | 2 |
| 000000002016-05-07-0000May 7 |
Guam[64] |
7 | 5 | 12 | c4Closed caucus |
777 (59.5%) | 528 (40.5%) |
4 | 5 | 9 |
3 | 0 | 3 |
0 | 0 | 0 |
| 000000002016-05-10-0000May 10 |
Nebraska[65] |
N/A | p4Closed primary |
42,692 (53.1%) | 37,744 (46.9%) |
Non-binding primary with no delegates allocated. |
| West Virginia[66] |
29 | 8 | 37 | p3Semi-closed primary |
86,914 (35.8%) | 124,700 (51.4%) |
11 | 6 | 17 |
18 | 2 | 20 |
0 | 0 | 0 |
| 000000002016-05-17-0000May 17 |
Kentucky[67][68] |
55 | 5 | 60 | p4Closed primary |
212,534 (46.8%) | 210,623 (46.3%) |
28 | 2 | 30 |
27 | 0 | 27 |
0 | 3 | 3 |
| Oregon[69][70][71] |
61 | 13 | 74 | p4Closed primary |
269,846 (42.1%) | 360,829 (56.2%) |
25 | 7 | 32 |
36 | 3 | 39 |
0 | 3 | 3 |
| 000000002016-05-24-0000May 24 |
Washington[72] |
N/A | p1Open primary[73][lower-alpha 7] |
420,461 (52.4%) | 382,293 (47.6%) |
Non-binding primary with no delegates allocated. |
| 000000002016-06-04-0000Jun 4 |
Virgin Islands[74][75][76] |
7 | 5 | 12 | c4Closed caucus |
1,326 (87.12%) | 196 (12.88%) |
7 | 5 | 12 |
0 | 0 | 0 |
0 | 0 | 0 |
| 000000002016-06-05-0000Jun 5 |
Puerto Rico[77] |
60 | 7 | 67 | p1Open primary |
52,658 (59.7%) | 33,368 (37.9%) |
37 | 6 | 43 |
23 | 0 | 23 |
0 | 1 | 1 |
| 000000002016-06-07-0000Jun 7 |
California[78][79] |
475 | 76 | 551 | p3Semi-closed primary |
2,745,302 (53.1%) | 2,381,722 (46.0%) |
254 | 66 | 320 |
221 | 0 | 221 |
0 | 10 | 10 |
| Montana[80][81] |
21 | 6 | 27 | p1Open primary |
55,805 (44.2%) | 65,156 (51.6%) |
10 | 5 | 15 |
11 | 1 | 12 |
0 | 0 | 0 |
| New Jersey[82][83][84] |
126 | 16 | 142 | p3Semi-closed primary |
566,247 (63.3%) | 328,058 (36.7%) |
79 | 12 | 91 |
47 | 2 | 49 |
0 | 2 | 2 |
| New Mexico[85][86] |
34 | 9 | 43 | p4Closed primary |
111,334 (51.5%) | 104,741 (48.5%) |
18 | 9 | 27 |
16 | 0 | 16 |
0 | 0 | 0 |
| North Dakota[87] |
18 | 5 | 23 | c1-scdOpen caucus[88][lower-alpha 8] |
106 SCD (25.6%) | 258 SCD (64.2%) |
5 | 1 | 6 |
13 | 1 | 14 |
0 | 3 | 3 |
| South Dakota[89][90] |
20 | 5 | 25 | p3Semi-closed primary[91] |
27,047 (51.0%) | 25,959 (49.0%) |
10 | 2 | 12 |
10 | 0 | 10 |
0 | 3 | 3 |
| 000000002016-06-14-0000Jun 14 |
District of Columbia[92][93] |
20 | 25 | 45 | p4Closed primary |
76,704 (78.0%) | 20,361 (20.7%) |
16 | 23 | 39 |
4 | 2 | 6 |
0 | 0 | 0 |
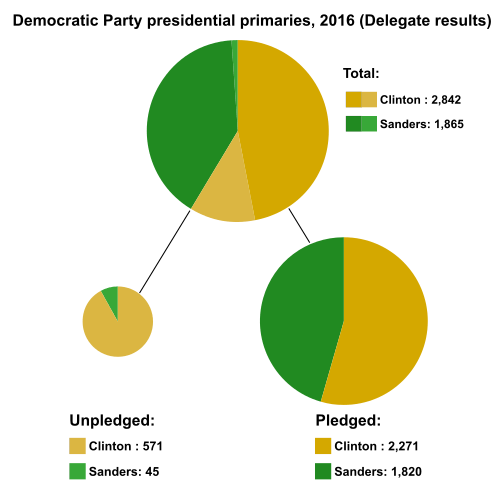
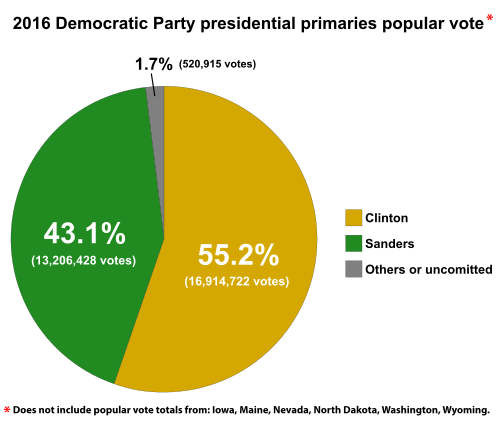
| Total |
4,051 |
712 |
4,763 |
|
16,847,084
(55.20%)[lower-alpha 1] |
13,168,222
(43.14%)[lower-alpha 1] |
2,205 |
570½ |
2,775½ |
1,846 |
43½ |
1,889½ |
0 | 97[lower-alpha 5] | 97[lower-alpha 5] |
| Date |
State/territory |
P |
U |
T |
Type |
Clinton |
Sanders |
P |
U |
T |
P |
U |
T |
P |
U |
T |
| Calculated delegates |
Popular vote or equivalent |
Clinton delegates |
Sanders delegates |
Available delegates |
| |
Detailed results
February
Iowa
- Precinct caucuses: February 1
- County conventions: March 12
- District conventions: April 30
- State convention: June 18
New Hampshire
| New Hampshire Democratic primary, February 9, 2016 |
| Candidate |
Popular vote |
Estimated delegates |
| Count |
Of total |
Pledged |
Unpledged |
Total |
| Bernie Sanders |
152,193 |
60.14% |
15 |
1 |
16 |
| Hillary Clinton |
95,355 |
37.68% |
9 |
6 |
15 |
| Martin O'Malley (withdrawn) |
667 |
0.26% |
| | |
| Vermin Supreme |
268 |
0.11% |
| | |
| David John Thistle |
226 |
0.09% |
| | |
| Graham Schwass |
143 |
0.06% |
| | |
| Steve Burke |
108 |
0.04% |
| | |
| Rocky De La Fuente |
96 |
0.04% |
| | |
| John Wolfe, Jr. |
54 |
0.02% |
| | |
| Jon Adams |
53 |
0.02% |
| | |
| Lloyd Thomas Kelso |
46 |
0.02% |
| | |
| Keith Russell Judd |
44 |
0.02% |
| | |
| Eric Elbot |
36 |
0.01% |
| | |
| Star Locke |
33 |
0.01% |
| | |
| William D. French |
29 |
0.01% |
| | |
| Mark Stewart Greenstein |
29 |
0.01% |
| | |
| Edward T. O'Donnell |
26 |
0.01% |
| | |
| James Valentine |
24 |
0.01% |
| | |
| Robert Lovitt |
22 |
0.01% |
| | |
| Michael Steinberg |
21 |
0.01% |
| | |
| William H. McGaughey, Jr. |
19 |
0.01% |
| | |
| Henry Hewes |
18 |
0.01% |
| | |
| Edward Sonnino |
17 |
0.01% |
| | |
| Steven Roy Lipscomb |
15 |
0.01% |
| | |
| Sam Sloan |
15 |
0.01% |
| | |
| Brock C. Hutton |
14 |
0.01% |
| | |
| Raymond Michael Moroz |
8 |
0.00% |
| | |
| Richard Lyons Weil |
8 |
0.00% |
| | |
| Write-ins |
3,475 |
1.37% |
| | |
| Uncommitted |
N/A |
0 |
1 |
1 |
| Total |
253,062 |
100% |
24 |
8 |
32 |
| Sources: The Green Papers New Hampshire Secretary of State |
Nevada
| Nevada Democratic caucuses, February 20, 2016 |
| Candidate |
County delegates |
Estimated delegates |
| Count |
Percentage |
Pledged |
Unpledged |
Total |
| Hillary Clinton |
6,440 |
52.64% |
20 |
4 |
24 |
| Bernie Sanders |
5,785 |
47.29% |
15 |
1 |
16 |
| Uncommitted |
8 |
0.07% |
0 |
3 |
3 |
| Total |
12,233 |
100% |
35 |
8 |
43 |
| Source: The Green Papers |
South Carolina
Super Tuesday
Alabama
Arkansas
American Samoa
Colorado
Georgia
Massachusetts
Results of the Massachusetts Democratic primary on March 1, 2016
| Candidate |
Popular vote[94] |
Estimated delegates[95] |
| Count |
Percentage |
Pledged |
Unpledged |
Total |
| Hillary Clinton |
606,822 | 49.73% |
46 | 21 | 67 |
| Bernie Sanders |
589,803 | 48.33% |
45 | 1 | 46 |
| Martin O'Malley (withdrawn) |
4,783 | 0.39% |
0 | 0 | 0 |
| Rocky De La Fuente |
1,545 | 0.13% |
0 | 0 | 0 |
| No Preference |
8,090 | 0.66% |
– | 2 | 2 |
| All Others |
4,927 | 0.40% |
0 | 0 | 0 |
| Blank votes |
4,326 | 0.35% |
– | – | – |
| Total |
1,220,296 | 100% |
91 | 24 | 115 |
Minnesota
| Minnesota Democratic caucuses, March 1, 2016 |
| Candidate |
Popular vote |
Estimated delegates |
| Count |
Percentage |
Pledged |
Unpledged |
Total |
| Bernie Sanders |
126,229 |
61.69% |
46 |
1 |
47 |
| Hillary Clinton |
78,381 |
38.31% |
31 |
13 |
44 |
| Uncommitted |
N/A |
0 |
2 |
2 |
| Total |
204,610 |
100% |
77 |
16 |
93 |
| Source: The Green Papers |
Oklahoma
| Oklahoma Democratic primary, March 1, 2016 |
| Candidate |
Popular vote |
Estimated delegates |
| Count |
Percentage |
Pledged |
Unpledged |
Total |
| Bernie Sanders |
174,228 |
51.88% |
21 |
1 |
22 |
| Hillary Clinton |
139,443 |
41.52% |
17 |
1 |
18 |
| Martin O'Malley (withdrawn) |
7,672 |
2.28% |
| | |
| Keith Russell Judd |
4,386 |
1.31% |
| | |
| Michael Alan Steinberg |
4,171 |
1.24% |
| | |
| Star Locke (withdrawn) |
3,458 |
1.03% |
| | |
| Rocky De La Fuente |
2,485 |
0.74% |
| | |
| Uncommitted |
N/A |
0 |
2 |
2 |
| Total |
335,843 |
100% |
38 |
4 |
42 |
| Source: The Green Papers, Oklahoma State Election Board |
Tennessee
| Tennessee Democratic primary, March 1, 2016 |
| Candidate |
Popular vote |
Estimated delegates |
| Count |
Percentage |
Pledged |
Unpledged |
Total |
| Hillary Clinton |
245,930 |
66.07% |
44 |
7 |
51 |
| Bernie Sanders |
120,800 |
32.45% |
23 |
0 |
23 |
| Martin O'Malley (withdrawn) |
2,025 |
0.54% |
| | |
| Uncommitted |
3,467 |
0.93% |
0 |
1 |
1 |
| Total |
372,222 |
100% |
67 |
8 |
75 |
| Source: The Green Papers |
Texas
| Texas Democratic primary, March 1, 2016 |
| Candidate |
Popular vote |
Estimated delegates |
| Count |
Percentage |
Pledged |
Unpledged |
Total |
| Hillary Clinton |
936,004 |
65.19% |
147 |
21 |
168 |
| Bernie Sanders |
476,547 |
33.19% |
75 |
0 |
75 |
| Rocky De La Fuente |
8,429 |
0.59% |
| | |
| Martin O'Malley (withdrawn) |
5,364 |
0.37% |
| | |
| Willie Wilson |
3,254 |
0.23% |
| | |
| Keith Russell Judd |
2,569 |
0.18% |
| | |
| Calvis L. Hawes |
2,017 |
0.14% |
| | |
| Star Locke |
1,711 |
0.12% |
| | |
| Uncommitted |
N/A |
0 |
8 |
8 |
| Total |
1,435,895 |
100% |
222 |
29 |
251 |
| Source: The Green Papers, Texas Secretary of State |
Virginia
Vermont
Early March
Kansas
| Kansas Democratic caucuses, March 5, 2016 |
| Candidate |
District delegates |
Estimated delegates |
| Count |
Percentage |
Pledged |
Unpledged |
Total |
| Bernie Sanders |
26,637 |
67.90% |
23 |
0 |
23 |
| Hillary Clinton |
12,593 |
32.10% |
10 |
4 |
14 |
| Uncommitted |
N/A |
0 |
0 |
0 |
| Total |
39,230 |
100% |
33 |
4 |
37 |
| Source: The Green Papers |
Louisiana
| Louisiana Democratic primary, March 5, 2016 |
| Candidate |
Popular vote |
Estimated delegates |
| Count |
Percentage |
Pledged |
Unpledged |
Total |
| Hillary Clinton |
221,733 |
71.12% |
37 |
7 |
44 |
| Bernie Sanders |
72,276 |
23.18% |
14 |
0 |
14 |
| Steve Burke |
4,785 |
1.53% |
| | |
| John Wolfe, Jr. |
4,512 |
1.45% |
| | |
| Martin O'Malley (withdrawn) |
2,550 |
0.82% |
| | |
| Willie Wilson |
1,423 |
0.46% |
| | |
| Keith Russell Judd |
1,357 |
0.44% |
| | |
| Rocky De La Fuente |
1,341 |
0.43% |
| | |
| Michael A. Steinberg |
993 |
0.32% |
| | |
| Henry Hewes |
806 |
0.26% |
| | |
| Uncommitted |
N/A |
0 |
1 |
1 |
| Total |
311,776 |
100% |
51 |
8 |
59 |
| Source: The Green Papers, Louisiana Secretary of States |
Nebraska
Democratic Presidential Caucuses
| Nebraska Democratic caucuses, March 5, 2016 |
| Candidate |
Popular vote |
Estimated delegates |
| Count |
Percentage |
Pledged |
Unpledged |
Total |
| Bernie Sanders |
19,120 |
57.14% |
15 |
1 |
16 |
| Hillary Clinton |
14,340 |
42.86% |
10 |
3 |
13 |
| Uncommitted |
N/A |
0 |
1 |
1 |
| Total |
33,460 |
100% |
25 |
5 |
30 |
| Source: The Green Papers |
Democratic Presidential Primary (Non-binding)
The Nebraska Democratic primary was held on May 10, 2016. The primary does not bind delegates. Delegates were bound by the caucuses on March 5, 2016.
Maine
| Maine Democratic caucuses, March 6, 2016 |
| Candidate |
State convention delegates |
Estimated delegates |
| Count |
Percentage |
Pledged |
Unpledged |
Total |
| Bernie Sanders |
2,226 |
64.17% |
17 |
1 |
18 |
| Hillary Clinton |
1,231 |
35.49% |
8 |
4 |
12 |
| Uncommitted |
12 |
0.35% |
0 |
0 |
0 |
| Total |
3,469 |
100% |
25 |
5 |
30 |
| Source: The Green Papers |
Democrats Abroad
Michigan
Mississippi
Northern Marianas
| Northern Marianas Democratic caucus, March 12, 2016 |
| Candidate |
Popular vote |
Estimated delegates |
| Count |
Percentage |
Pledged |
Unpledged |
Total |
| Hillary Clinton |
102 |
53.97% |
4 |
1 |
5 |
| Bernie Sanders |
65 |
34.39% |
2 |
0 |
2 |
| Uncommitted |
22 |
11.64% |
0 |
4 |
4 |
| Total |
189 |
100% |
6 |
5 |
11 |
| Source: The Green Papers |
Late March
Florida
Illinois
| Illinois Democratic primary, March 15, 2016 |
| Candidate |
Popular vote |
Estimated delegates |
| Count |
Percentage |
Pledged |
Unpledged |
Total |
| Hillary Clinton |
1,039,555 |
50.56% |
79 |
24 |
103 |
| Bernie Sanders |
999,494 |
48.61% |
77 |
1 |
78 |
| Willie Wilson |
6,565 |
0.32% |
| | |
| Martin O'Malley (withdrawn) |
6,197 |
0.30% |
0 |
1 |
1 |
| Lawrence "Larry Joe" Cohen |
2,407 |
0.12% |
| | |
| Rocky De La Fuente |
1,802 |
0.09% |
| | |
| Others |
27 |
0.00% |
| | |
| Uncommitted |
N/A |
0 |
1 |
1 |
| Total |
2,056,047 |
100% |
156 |
27 |
183 |
Source: The Green Papers, Illinois Board of Elections and
Illinois Democratic Party - Official Pledged Delegates Allocation |
Missouri
North Carolina
| North Carolina Democratic primary, March 15, 2016 |
| Candidate |
Popular vote |
Estimated delegates |
| Count |
Percentage |
Pledged |
Unpledged |
Total |
| Hillary Clinton |
622,915 |
54.50% |
60 |
8 |
68 |
| Bernie Sanders |
467,018 |
40.86% |
47 |
2 |
49 |
| Martin O'Malley (withdrawn) |
12,122 |
1.06% |
| | |
| Rocky De La Fuente |
3,376 |
0.30% |
| | |
| No Preference |
37,485 |
3.28% |
| | |
| Uncommitted |
N/A |
|
3 |
3 |
| Total |
1,142,916 |
100% |
107 |
13 |
120 |
Sources: The Green Papers, North Carolina State board of Elections,
North Carolina Democratic Party - Official Delegation for Pledged Delegates |
Ohio
Arizona
Idaho
Utah
| Utah Democratic caucuses, March 22, 2016 |
| Candidate |
Popular vote |
Estimated delegates |
| Count |
Percentage |
Pledged |
Unpledged |
Total |
| Bernie Sanders |
62,992 |
79.21% |
27 |
2 |
29 |
| Hillary Clinton |
16,166 |
20.33% |
6 |
2 |
8 |
| Others |
34 |
0.04% |
| | |
| Uncommitted |
334 |
0.42% |
0 |
0 |
0 |
| Total |
79,526 |
100% |
33 |
4 |
37 |
| Source: Utah Democratic Party |
Alaska
Hawaii
Washington
| Washington Democratic caucuses, March 26, 2016 |
| Candidate |
District delegates |
Estimated delegates |
| Count |
Percentage |
Pledged |
Unpledged |
Total |
| Bernie Sanders |
19,159 |
72.72% |
74 |
0 |
74 |
| Hillary Clinton |
7,140 |
27.10% |
27 |
10 |
37 |
| Others |
|
|
| | |
| Uncommitted |
46 |
0.18% |
0 |
7 |
7 |
| Total |
26,345 |
100% |
101 |
17 |
118 |
| Source: The Green Papers |
April
Wisconsin
Wyoming
| Wyoming Democratic caucuses, April 9, 2016 |
| Candidate |
County delegates |
Estimated
national delegates |
| Count |
Percentage |
Pledged |
Unpledged |
Total |
| Bernie Sanders |
156 |
55.7% |
7 |
0 |
7 |
| Hillary Clinton |
124 |
44.3% |
7 |
4 |
11 |
| Uncommitted |
N/A |
– |
– |
– |
| Total |
|
100% |
14 |
4 |
18 |
| Source: The Green Papers |
New York
| New York Democratic primary, April 19, 2016 |
| Candidate |
Popular vote |
Estimated delegates |
| Count |
Percentage |
Pledged |
Unpledged |
Total |
| Hillary Clinton |
1,133,980 |
57.54% |
139 |
41 |
180 |
| Bernie Sanders |
820,056 |
41.62% |
108 |
0 |
108 |
| Void |
11,306 |
0.57% |
|
|
|
| Blank Votes |
5,358 |
0.27% |
|
|
|
| Uncommitted |
N/A |
0 |
3 |
3 |
| Total |
1,970,900 |
100% |
247 |
44 |
291 |
| Source: Green Papers, New York State Board of Elections |
Connecticut
Delaware
Maryland
| Maryland Democratic primary, April 26, 2016 |
| Candidate |
Popular vote |
Estimated delegates |
| Count |
Percentage |
Pledged |
Unpledged |
Total |
| Hillary Clinton |
573,242 |
62.53% |
60 |
17 |
77 |
| Bernie Sanders |
309,990 |
33.81% |
35 |
1 |
36 |
| Rocky De La Fuente |
3,582 |
0.39% |
N/A |
| Uncommitted |
29,949 |
3.27% |
0 |
6 |
6 |
| Total |
916,763 |
100% |
95 |
24 |
119 |
Source: The Green Papers, Maryland State Board of Elections - Official Primary Results,
MDP Announces DNC Delegates, Alternates and State DNC Members,
MDP Announces District-Level Delegate Winners |
Pennsylvania
Rhode Island
May
Indiana
Guam
West Virginia
Kentucky
Oregon
June
Virgin Islands
Puerto Rico
California
Democratic Party's presidential nominating process in California, 2016
– Summary of results –
| Candidate |
Popular vote |
Estimated delegates |
| Count |
Percentage |
Pledged |
Unpledged |
Total |
| Hillary Clinton |
2,745,302 |
53.07% |
254 |
66 |
320 |
| Bernie Sanders |
2,381,722 |
46.04% |
221 |
0 |
221 |
| Willie Wilson |
12,014 |
0.23% |
| | |
| Michael Steinberg |
10,880 |
0.21% |
| | |
| Roque De La Fuente |
8,453 |
0.16% |
| | |
| Henry Hewes |
7,743 |
0.15% |
| | |
| Keith Judd |
7,201 |
0.14% |
| | |
| Write-in |
23 |
0.00% |
| | |
| Uncommitted |
N/A |
|
10 |
10 |
| Total |
5,173,338 |
100% |
475 |
76 |
551 |
| Source: California Secretary of State - Presidential Primary Election Statement of Votes The Green Papers |
Montana
New Jersey
New Mexico
North Dakota
| North Dakota Democratic caucuses, June 7, 2016 |
| Candidate |
District delegates |
State delegates |
| Count |
Percentage |
Pledged |
Unpledged |
Total |
| Bernie Sanders |
253 |
64.21% |
13 |
1 |
14 |
| Hillary Clinton |
101 |
25.63% |
5 |
1 |
6 |
| Uncommitted |
40 |
10.15% |
0 |
0 |
0 |
| Total |
394 |
100% |
18 |
5 |
23 |
| Source: The Green Papers |
South Dakota
District of Columbia
See also
Notes
- 1 2 3 4 5 6 Does not include popular vote totals from Iowa, Maine, Nevada, North Dakota, Washington, Wyoming, or non-binding primaries
- ↑ Differences between types:
- Open: Anyone can participate regardless of their registered party affiliation.
- Semi-open: Anyone can participate except registered Republicans.
- Semi-closed: Only registered Democrats or undeclared can participate.
- Closed: Only registered Democrats can participate.
- ↑ Differences between types:
- CD: 'Popular vote' tallies the county delegates.
- LDD: 'Popular vote' tallies the legislative district delegates.
- SCD: 'Popular vote' tallies the state convention delegates.
- SDE: 'Popular vote' tallies the state delegate equivalents.
- ↑ Pledged delegates are elected with the understanding that they will support a specific candidate.
Unpledged delegates (superdelegates) are not required to voice support for a specific candidate.
- 1 2 3 4 5 One Illinois superdelegate is still committed to O'Malley. Therefore, the total number of available delegates is one less than expected.
- ↑ There are 8 unpledged delegates from Democrats Abroad that each cast half a vote at the national convention.
- ↑ Open to all voters excluding those who caucused with the Republicans on February 20.
- ↑ Open to all voters, though those who attend must state they will identify as a Democrat for the 2016 election.
References
- 1 2 Berg-Andersson, Richard E. "Democratic Convention". The Green Papers. Retrieved June 13, 2016.
- ↑ Kamisar, Ben (June 8, 2016). "DNC avoids calling Clinton presumptive nominee". The Hill. Retrieved June 8, 2016.
- ↑ Dann, Carrie (26 July 2016). "Hillary Clinton Becomes First Female Nominee of Major U.S. Political Party". NBC News. NBC. Retrieved 27 July 2016.
- ↑ 2016 Delegate Count and Primary Results
- ↑ "Iowa Caucus Results". The New York Times. Retrieved March 28, 2016.
- ↑ "New Hampshire Democratic Primary Results". William M. Gardner New Hampshire Secretary of State. Retrieved April 1, 2016.
- ↑ "Nevada Caucus Results". The New York Times. Retrieved May 15, 2016.
- ↑ "South Carolina Democratic Primary Official Results". South Carolina State Election Commission. Retrieved April 1, 2016.
- ↑ "Alabama Democratic Party certified Election Results" (PDF). Secretary of State of Alabama. Retrieved April 1, 2016.
- ↑ Berg-Andersson, Richard E. "American Samoa Democratic Delegation 2016". The Green Papers. Retrieved March 30, 2016.
- ↑ "Arkansas Official County results (provisional)". Arkansas Secretary of State. Retrieved April 1, 2016.
- ↑ Berg-Andersson, Richard E. (April 15, 2016). "Colorado Democratic Delegation 2016". The Green Papers. Retrieved April 19, 2016.
- ↑ "Georgia Primary Results". The New York Times. Retrieved March 28, 2016.
- ↑ "Massachusetts Primary Results". The New York Times. Retrieved March 28, 2016.
- ↑ "Massachusetts Democratic Delegation 2016". thegreenpapers.com. Retrieved 13 June 2016.
- ↑ "Minnesota Caucus Results". The New York Times. Retrieved March 28, 2016.
- ↑ "Oklahoma State Election Board - 2016 March PPP Election". ok.gov. Retrieved 17 June 2016.
- ↑ "Oklahoma Primary Results". The New York Times. Retrieved March 28, 2016.
- ↑ "Tennessee Primary Results". The New York Times. Retrieved March 28, 2016.
- ↑ "Texas Primary Results". The New York Times. Retrieved March 28, 2016.
- ↑ Vermont Secretary of State
- ↑ "Vermont Primary Results". The New York Times. Retrieved March 28, 2016.
- ↑ "Virginia Primary Results". The New York Times. Retrieved March 28, 2016.
- ↑ "Kansas Caucus Results". The New York Times. Retrieved March 28, 2016.
- ↑ "Louisiana Primary Results". The New York Times. Retrieved March 28, 2016.
- ↑ "Nebraska Caucus Results". The New York Times. Retrieved March 28, 2016.
- ↑ "Maine Caucus Results". The New York Times. Retrieved March 28, 2016.
- ↑ Berg-Andersson, Richard E. "Democrats Abroad Democratic Delegation 2016". The Green Papers. Retrieved March 30, 2016.
- ↑ Berg-Andersson, Richard E. "Michigan Democratic Delegation 2016". The Green Papers. Retrieved March 30, 2016. (projection computed by The Green Papers until full official results are published)
- ↑ Johnson, Ruth. "2016 Michigan Election results". Michigan Department of State. Retrieved April 1, 2016.
- ↑ "Mississippi Primary Results". Mississippi Secretary of State. Retrieved June 16, 2016.
- ↑ Berg-Andersson, Richard E. "Northern Marianas Democratic Delegation 2016". The Green Papers. Retrieved March 30, 2016.
- ↑ Berg-Andersson, Richard E. "Florida Democratic Delegation 2016". The Green Papers. Retrieved March 30, 2016. (projection computed by The Green Papers until full official results are published)
- ↑ "2016 Presidential Preference Primary - Official Election Results". Florida Department of State Division of elections. Retrieved March 31, 2016.
- ↑ Berg-Andersson, Richard E. "Illinois Democratic Delegation 2016". The Green Papers. Retrieved March 30, 2016. (projection computed by The Green Papers until full official results are published)
- ↑ Berg-Andersson, Richard E. "Missouri Democratic Delegation 2016". The Green Papers. Retrieved March 30, 2016. (projection computed by The Green Papers until full official results are published)
- ↑ Berg-Andersson, Richard E. "North Carolina Democratic Delegation 2016". The Green Papers. Retrieved March 30, 2016. (projection computed by The Green Papers until full official results are published)
- ↑ "Ohio Primary Results". The New York Times. Retrieved March 28, 2016.
- ↑ "Ohio Democratic Delegation 2016". thegreenpapers.com. Retrieved 23 April 2016.
- ↑ "State of Arizona Official Canvass - 2016 Presidential Preference Election - March 22, 2016" (PDF). Arizona Secretary of State. April 4, 2016. Retrieved April 6, 2016.
- ↑ Berg-Andersson, Richard E. "Arizona Democratic Delegation 2016". The Green Papers. Retrieved March 30, 2016.
- ↑ Berg-Andersson, Richard E. "Idaho Democratic Delegation 2016". The Green Papers. Retrieved March 30, 2016. (projection computed by The Green Papers until full official results are published)
- ↑ Berg-Andersson, Richard E. "Utah Democratic Delegation 2016". The Green Papers. Retrieved March 30, 2016. (projection computed by The Green Papers until full official results are published)
- ↑ "Alaska Caucus Results". The New York Times. Retrieved March 28, 2016.
- ↑ "Alaska Democratic Delegation 2016". thegreenpapers.com. Retrieved 23 April 2016.
- ↑ "Hawaii Caucus Results". The New York Times. Retrieved March 28, 2016.
- ↑ Berg-Andersson, Richard E. "Washington Democratic Delegation 2016". The Green Papers. Retrieved March 30, 2016. (projection computed by The Green Papers until full official results are published)
- ↑ Wisconsin Official Results
- ↑ Berg-Andersson, Richard E. "Wisconsin Democratic Delegation 2016". The Green Papers. Retrieved April 6, 2016. (projection computed by The Green Papers until full official results are published)
- ↑ Berg-Andersson, Richard E. "Wyoming Democratic Delegation 2016". The Green Papers. Retrieved April 25, 2016. (projection computed by The Green Papers until full official results are published)
- ↑ New York State Board of Elections
- ↑ "New York Primary Results". The New York Times. Retrieved April 17, 2016.
- ↑ "New York Democratic Delegation 2016". thegreenpapers.com. Retrieved 23 April 2016.
- ↑ Connecticut Secretary of State - Official Primary Results
- ↑ "Connecticut Democratic Delegation 2016". thegreenpapers.com. Retrieved 27 April 2016.
- ↑ "State of Delaware - Office of the State Election Commissioner". delaware.gov. Retrieved 18 June 2016.
- ↑ "Delaware Primary Results". The New York Times. Retrieved April 26, 2016.
- ↑ "Maryland Official Primary Results". Maryland State Board of Elections. Retrieved June 15, 2016.
- ↑ "Maryland Democratic Delegation 2016". thegreenpapers.com. Retrieved 27 April 2016.
- ↑ "Pennsylvania Democratic Delegation 2016". thegreenpapers.com. Retrieved 27 April 2016.
- ↑ "Rhode Island Primary Results". The New York Times. Retrieved April 26, 2016.
- ↑ "RI.gov: Election Results". ri.gov. Retrieved 6 May 2016.
- ↑ "Indiana Democratic Delegation 2016 - Official Primary Results". thegreenpapers.com. Retrieved 4 May 2016.
- ↑ "Guam Democratic Delegation". thegreenpapers.com. Retrieved 7 May 2016.
- ↑ "Election Results". Nebraska Secretary of State . Retrieved May 10, 2016.
- ↑ "West Virginia Democratic Delegation 2016". thegreenpapers.com. Retrieved 12 May 2016.
- ↑ Kentucky Secretary of State - Official Primary Results
- ↑ "Kentucky Democratic Delegation 2016". thegreenpapers.com. Retrieved 17 May 2016.
- ↑ Oregon Secretary of State - Official Election Results
- ↑ "Unofficial Election Results". Oregon Secretary of State. Retrieved May 18, 2016.
- ↑ "Oregon Democratic Delegation 2016". thegreenpapers.com. Retrieved 20 May 2016.
- ↑ "Presidential Primary Results". wa.gov. May 24, 2016. Retrieved 28 May 2016.
- ↑ "2016 Presidential Primary". wa.gov. Retrieved 12 May 2016.
- ↑ "Clinton moves closer to nomination, sweeps in Virgin Islands". Retrieved June 5, 2016.
- ↑ "Delegate Tracker". Associated Press. June 6, 2016. Retrieved June 6, 2016.
- ↑ "Virgin Islands Democratic Delegation 2016". thegreenpapers.com. Retrieved July 17, 2016.
- ↑ "Puerto Rico Democratic Delegation 2016". thegreenpapers.com. Retrieved 19 April 2016.
- ↑ "California Democratic Primary - Official Election Results" (PDF). ca.gov. Retrieved 25 July 2016.
- ↑ "California Democratic Delegation 2016". thegreenpapers.com. Retrieved 29 June 2016.
- ↑ Montana Secretary of State - Official Primary Results
- ↑ "Montana Democratic Delegation 2016". thegreenpapers.com. Retrieved 13 June 2016.
- ↑ New Jersey Democratic Primary Official Results - New Jersey Department of State
- ↑ "New Jersey Democratic Primary Results" (PDF). New Jersey State Elections. June 7, 2016. Retrieved June 15, 2016.
- ↑ "New Jersey Democrat". The Green Papers. June 7, 2016. Retrieved June 7, 2016.
- ↑ New Mexico State Board of Elections - Official Primary Results
- ↑ "New Mexico Democratic Delegation 2016". thegreenpapers.com. Retrieved 13 June 2016.
- ↑ "North Dakota Democrat". The Green Papers. June 7, 2016. Retrieved June 7, 2016.
- ↑ "North Dakota Democratic-NPL Caucus Guide 2016". Retrieved 29 May 2016.
- ↑ South Dakota Secretary of State - Official Primary Results
- ↑ "South Dakota Democratic Delegation 2016". thegreenpapers.com. Retrieved 13 June 2016.
- ↑ "Upcoming Elections: South Dakota Secretary of State, Shantel Krebs". sdsos.gov. Retrieved 19 April 2016.
- ↑ District of Columbia Board of Elections - Official Primary Results
- ↑ "District of Columbia Democratic Delegation 2016". thegreenpapers.com. Retrieved 14 June 2016.
- ↑ "2016 President Democratic Primary". Retrieved 15 March 2016.
- ↑ The Green Papers
|
|---|
|
|
|
| Democratic Party | |
|---|
|
| Republican Party | |
|---|
|
| Libertarian Party | |
|---|
|
| Green Party | |
|---|
|
| Constitution Party | |
|---|
|
| Independent | |
|---|
|
|
|
|---|
|
| Election timelines | |
|---|
|
| National polling | |
|---|
|
| State polling | |
|---|
|
| Fundraising | |
|---|
|
| Debates and forums | |
|---|
|
| Straw polls | |
|---|
|
| Major events | |
|---|
|
Caucuses
and primaries | | |
|---|
| | |
|---|
| Libertarian Party | |
|---|
| Green Party | |
|---|
| Constitution Party | |
|---|
|
|---|
|
| Results breakdown | |
|---|
|
National
conventions | |
|---|
|
| Reforms | |
|---|