Rain

| Part of the nature series |
| Weather |
|---|
| Calendar seasons |
| Tropical seasons |
| Storms |
| Precipitation |
| Topics |
|
|
 |
|
| Problems playing this file? See media help. | |
Rain is liquid water in the form of droplets that have condensed from atmospheric water vapor and then precipitated—that is, become heavy enough to fall under gravity. Rain is a major component of the water cycle and is responsible for depositing most of the fresh water on the Earth. It provides suitable conditions for many types of ecosystems, as well as water for hydroelectric power plants and crop irrigation.
The major cause of rain production is moisture moving along three-dimensional zones of temperature and moisture contrasts known as weather fronts. If enough moisture and upward motion is present, precipitation falls from convective clouds (those with strong upward vertical motion) such as cumulonimbus (thunder clouds) which can organize into narrow rainbands. In mountainous areas, heavy precipitation is possible where upslope flow is maximized within windward sides of the terrain at elevation which forces moist air to condense and fall out as rainfall along the sides of mountains. On the leeward side of mountains, desert climates can exist due to the dry air caused by downslope flow which causes heating and drying of the air mass. The movement of the monsoon trough, or intertropical convergence zone, brings rainy seasons to savannah climes.
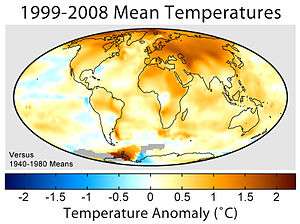
The urban heat island effect leads to increased rainfall, both in amounts and intensity, downwind of cities. Global warming is also causing changes in the precipitation pattern globally, including wetter conditions across eastern North America and drier conditions in the tropics. Antarctica is the driest continent. The globally averaged annual precipitation over land is 715 mm (28.1 in), but over the whole Earth it is much higher at 990 mm (39 in).[1] Climate classification systems such as the Köppen climate classification system use average annual rainfall to help differentiate between differing climate regimes. Rainfall is measured using rain gauges. Rainfall amounts can be estimated by weather radar.
Rain is also known or suspected on other planets, where it may be composed of methane, neon, sulfuric acid, or even iron rather than water.
Formation
Water-saturated air
Air contains water vapor, and the amount of water in a given mass of dry air, known as the mixing ratio, is measured in grams of water per kilogram of dry air (g/kg).[2][3] The amount of moisture in air is also commonly reported as relative humidity; which is the percentage of the total water vapor air can hold at a particular air temperature.[4] How much water vapor a parcel of air can contain before it becomes saturated (100% relative humidity) and forms into a cloud (a group of visible and tiny water and ice particles suspended above the Earth's surface)[5] depends on its temperature. Warmer air can contain more water vapor than cooler air before becoming saturated. Therefore, one way to saturate a parcel of air is to cool it. The dew point is the temperature to which a parcel must be cooled in order to become saturated.[6]
There are four main mechanisms for cooling the air to its dew point: adiabatic cooling, conductive cooling, radiational cooling, and evaporative cooling. Adiabatic cooling occurs when air rises and expands.[7] The air can rise due to convection, large-scale atmospheric motions, or a physical barrier such as a mountain (orographic lift). Conductive cooling occurs when the air comes into contact with a colder surface,[8] usually by being blown from one surface to another, for example from a liquid water surface to colder land. Radiational cooling occurs due to the emission of infrared radiation, either by the air or by the surface underneath.[9] Evaporative cooling occurs when moisture is added to the air through evaporation, which forces the air temperature to cool to its wet-bulb temperature, or until it reaches saturation.[10]
The main ways water vapor is added to the air are: wind convergence into areas of upward motion,[11] precipitation or virga falling from above,[12] daytime heating evaporating water from the surface of oceans, water bodies or wet land,[13] transpiration from plants,[14] cool or dry air moving over warmer water,[15] and lifting air over mountains.[16] Water vapor normally begins to condense on condensation nuclei such as dust, ice, and salt in order to form clouds. Elevated portions of weather fronts (which are three-dimensional in nature)[17] force broad areas of upward motion within the Earth's atmosphere which form clouds decks such as altostratus or cirrostratus.[18] Stratus is a stable cloud deck which tends to form when a cool, stable air mass is trapped underneath a warm air mass. It can also form due to the lifting of advection fog during breezy conditions.[19]
Coalescence and fragmentation

Coalescence occurs when water droplets fuse to create larger water droplets. Air resistance typically causes the water droplets in a cloud to remain stationary. When air turbulence occurs, water droplets collide, producing larger droplets. As these larger water droplets descend, coalescence continues, so that drops become heavy enough to overcome air resistance and fall as rain. Coalescence generally happens most often in clouds above freezing, and is also known as the warm rain process.[20] In clouds below freezing, when ice crystals gain enough mass they begin to fall. This generally requires more mass than coalescence when occurring between the crystal and neighboring water droplets. This process is temperature dependent, as supercooled water droplets only exist in a cloud that is below freezing. In addition, because of the great temperature difference between cloud and ground level, these ice crystals may melt as they fall and become rain.[21]
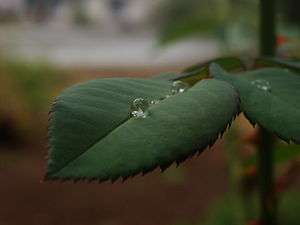
Raindrops have sizes ranging from 0.1 to 9 mm (0.0039 to 0.3543 in) mean diameter, above which they tend to break up. Smaller drops are called cloud droplets, and their shape is spherical. As a raindrop increases in size, its shape becomes more oblate, with its largest cross-section facing the oncoming airflow. Large rain drops become increasingly flattened on the bottom, like hamburger buns; very large ones are shaped like parachutes.[22][23] Contrary to popular belief, their shape does not resemble a teardrop.[24] The biggest raindrops on Earth were recorded over Brazil and the Marshall Islands in 2004 — some of them were as large as 10 mm (0.39 in). The large size is explained by condensation on large smoke particles or by collisions between drops in small regions with particularly high content of liquid water.[25]
Rain drops associated with melting hail tend to be larger than other rain drops.[26]
Intensity and duration of rainfall are usually inversely related, i.e., high intensity storms are likely to be of short duration and low intensity storms can have a long duration.[27][28]
Droplet size distribution
The final droplet size distribution is an exponential distribution. The number of droplets with diameter between and per unit volume of space is . This is commonly referred to as the Marshall–Palmer law after the researchers who first characterized it.[23][29] The parameters are somewhat temperature-dependent,[30] and the slope also scales with the rate of rainfall (d in centimeters and R in millimetres per hour).[23]


Deviations can occur for small droplets and during different rainfall conditions. The distribution tends to fit averaged rainfall, while instantaneous size spectra often deviate and have been modeled as gamma distributions.[31] The distribution has an upper limit due to droplet fragmentation.[23]
Raindrop impacts
Raindrops impact at their terminal velocity, which is greater for larger drops due to their larger mass to drag ratio. At sea level and without wind, 0.5 mm (0.020 in) drizzle impacts at 2 m/s (6.6 ft/s) or 7.2 km/h (4.5 mph), while large 5 mm (0.20 in) drops impact at around 9 m/s (30 ft/s) or 32 km/h (20 mph).[32]
Rain falling on loosely packed material such as newly fallen ash can produce dimples that can be fossilized.[33] The air density dependence of the maximum raindrop diameter together with fossil raindrop imprints has been used to constrain the density of the air 2.7 billion years ago.[34]
The sound of raindrops hitting water is caused by bubbles of air oscillating underwater.[35][36]
The METAR code for rain is RA, while the coding for rain showers is SHRA.[37]
Virga
In certain conditions precipitation may fall from a cloud but then evaporates or sublimes before reaching the ground. This is termed virga and is more often seen in hot and dry climates.
Causes
Frontal activity
Stratiform (a broad shield of precipitation with a relatively similar intensity) and dynamic precipitation (convective precipitation which is showery in nature with large changes in intensity over short distances) occur as a consequence of slow ascent of air in synoptic systems (on the order of cm/s), such as in the vicinity of cold fronts and near and poleward of surface warm fronts. Similar ascent is seen around tropical cyclones outside of the eyewall, and in comma-head precipitation patterns around mid-latitude cyclones.[38] A wide variety of weather can be found along an occluded front, with thunderstorms possible, but usually their passage is associated with a drying of the air mass. Occluded fronts usually form around mature low-pressure areas.[39] What separates rainfall from other precipitation types, such as ice pellets and snow, is the presence of a thick layer of air aloft which is above the melting point of water, which melts the frozen precipitation well before it reaches the ground. If there is a shallow near surface layer that is below freezing, freezing rain (rain which freezes on contact with surfaces in subfreezing environments) will result.[40] Hail becomes an increasingly infrequent occurrence when the freezing level within the atmosphere exceeds 3,400 m (11,000 ft) above ground level.[41]
Convection
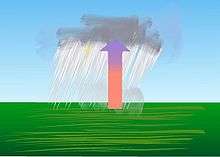

Convective rain, or showery precipitation, occurs from convective clouds (e.g., cumulonimbus or cumulus congestus). It falls as showers with rapidly changing intensity. Convective precipitation falls over a certain area for a relatively short time, as convective clouds have limited horizontal extent. Most precipitation in the tropics appears to be convective; however, it has been suggested that stratiform precipitation also occurs.[38][42] Graupel and hail indicate convection.[43] In mid-latitudes, convective precipitation is intermittent and often associated with baroclinic boundaries such as cold fronts, squall lines, and warm fronts.[44]
Orographic effects
Orographic precipitation occurs on the windward side of mountains and is caused by the rising air motion of a large-scale flow of moist air across the mountain ridge, resulting in adiabatic cooling and condensation. In mountainous parts of the world subjected to relatively consistent winds (for example, the trade winds), a more moist climate usually prevails on the windward side of a mountain than on the leeward or downwind side. Moisture is removed by orographic lift, leaving drier air (see katabatic wind) on the descending and generally warming, leeward side where a rain shadow is observed.[16]
In Hawaii, Mount Waiʻaleʻale, on the island of Kauai, is notable for its extreme rainfall, as it has the second highest average annual rainfall on Earth, with 12,000 mm (460 in).[45] Systems known as Kona storms affect the state with heavy rains between October and April.[46] Local climates vary considerably on each island due to their topography, divisible into windward (Koʻolau) and leeward (Kona) regions based upon location relative to the higher mountains. Windward sides face the east to northeast trade winds and receive much more rainfall; leeward sides are drier and sunnier, with less rain and less cloud cover.[47]
In South America, the Andes mountain range blocks Pacific moisture that arrives in that continent, resulting in a desertlike climate just downwind across western Argentina.[48] The Sierra Nevada range creates the same effect in North America forming the Great Basin and Mojave Deserts.[49][50]
Within the tropics
The wet, or rainy, season is the time of year, covering one or more months, when most of the average annual rainfall in a region falls.[51] The term green season is also sometimes used as a euphemism by tourist authorities.[52] Areas with wet seasons are dispersed across portions of the tropics and subtropics.[53] Savanna climates and areas with monsoon regimes have wet summers and dry winters. Tropical rainforests technically do not have dry or wet seasons, since their rainfall is equally distributed through the year.[54] Some areas with pronounced rainy seasons will see a break in rainfall mid-season when the intertropical convergence zone or monsoon trough move poleward of their location during the middle of the warm season.[27] When the wet season occurs during the warm season, or summer, rain falls mainly during the late afternoon and early evening hours. The wet season is a time when air quality improves,[55] freshwater quality improves,[56][57] and vegetation grows significantly.
Tropical cyclones, a source of very heavy rainfall, consist of large air masses several hundred miles across with low pressure at the centre and with winds blowing inward towards the centre in either a clockwise direction (southern hemisphere) or counter clockwise (northern hemisphere).[58] Although cyclones can take an enormous toll in lives and personal property, they may be important factors in the precipitation regimes of places they impact, as they may bring much-needed precipitation to otherwise dry regions.[59] Areas in their path can receive a year's worth of rainfall from a tropical cyclone passage.[60]
Human influence
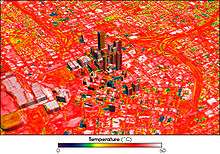
The fine particulate matter produced by car exhaust and other human sources of pollution forms cloud condensation nuclei, leads to the production of clouds and increases the likelihood of rain. As commuters and commercial traffic cause pollution to build up over the course of the week, the likelihood of rain increases: it peaks by Saturday, after five days of weekday pollution has been built up. In heavily populated areas that are near the coast, such as the United States' Eastern Seaboard, the effect can be dramatic: there is a 22% higher chance of rain on Saturdays than on Mondays.[61] The urban heat island effect warms cities 0.6 °C (1.1 °F) to 5.6 °C (10.1 °F) above surrounding suburbs and rural areas. This extra heat leads to greater upward motion, which can induce additional shower and thunderstorm activity. Rainfall rates downwind of cities are increased between 48% and 116%. Partly as a result of this warming, monthly rainfall is about 28% greater between 32 to 64 km (20 to 40 mi) downwind of cities, compared with upwind.[62] Some cities induce a total precipitation increase of 51%.[63]
Increasing temperatures tend to increase evaporation which can lead to more precipitation. Precipitation generally increased over land north of 30°N from 1900 through 2005 but has declined over the tropics since the 1970s. Globally there has been no statistically significant overall trend in precipitation over the past century, although trends have varied widely by region and over time. Eastern portions of North and South America, northern Europe, and northern and central Asia have become wetter. The Sahel, the Mediterranean, southern Africa and parts of southern Asia have become drier. There has been an increase in the number of heavy precipitation events over many areas during the past century, as well as an increase since the 1970s in the prevalence of droughts—especially in the tropics and subtropics. Changes in precipitation and evaporation over the oceans are suggested by the decreased salinity of mid- and high-latitude waters (implying more precipitation), along with increased salinity in lower latitudes (implying less precipitation and/or more evaporation). Over the contiguous United States, total annual precipitation increased at an average rate of 6.1 percent since 1900, with the greatest increases within the East North Central climate region (11.6 percent per century) and the South (11.1 percent). Hawaii was the only region to show a decrease (−9.25 percent).[64]
Analysis of 65 years of United States of America rainfall records show the lower 48 states have an increase in heavy downpours since 1950. The largest increases are in the Northeast and Midwest, which in the past decade, have seen 31 and 16 percent more heavy downpours compared to the 1950s. Rhode Island is the state with the largest increase 104%. McAllen, Texas is the city with the largest increase, 700%. Heavy downpour in the analysis are the days where total precipitation exceeded the top 1 percent of all rain and snow days during the years 1950-2014[65][66]
The most successful attempts at influencing weather involve cloud seeding, which include techniques used to increase winter precipitation over mountains and suppress hail.[67]
Characteristics
Patterns

Rainbands are cloud and precipitation areas which are significantly elongated. Rainbands can be stratiform or convective,[68] and are generated by differences in temperature. When noted on weather radar imagery, this precipitation elongation is referred to as banded structure.[69] Rainbands in advance of warm occluded fronts and warm fronts are associated with weak upward motion,[70] and tend to be wide and stratiform in nature.[71]
Rainbands spawned near and ahead of cold fronts can be squall lines which are able to produce tornadoes.[72] Rainbands associated with cold fronts can be warped by mountain barriers perpendicular to the front's orientation due to the formation of a low-level barrier jet.[73] Bands of thunderstorms can form with sea breeze and land breeze boundaries, if enough moisture is present. If sea breeze rainbands become active enough just ahead of a cold front, they can mask the location of the cold front itself.[74]
Once a cyclone occludes, a trough of warm air aloft, or "trowal" for short, will be caused by strong southerly winds on its eastern periphery rotating aloft around its northeast, and ultimately northwestern, periphery (also known as the warm conveyor belt), forcing a surface trough to continue into the cold sector on a similar curve to the occluded front. The trowal creates the portion of an occluded cyclone known as its comma head, due to the comma-like shape of the mid-tropospheric cloudiness that accompanies the feature. It can also be the focus of locally heavy precipitation, with thunderstorms possible if the atmosphere along the trowal is unstable enough for convection.[75] Banding within the comma head precipitation pattern of an extratropical cyclone can yield significant amounts of rain.[76] Behind extratropical cyclones during fall and winter, rainbands can form downwind of relative warm bodies of water such as the Great Lakes. Downwind of islands, bands of showers and thunderstorms can develop due to low level wind convergence downwind of the island edges. Offshore California, this has been noted in the wake of cold fronts.[77]
Rainbands within tropical cyclones are curved in orientation. Tropical cyclone rainbands contain showers and thunderstorms that, together with the eyewall and the eye, constitute a hurricane or tropical storm. The extent of rainbands around a tropical cyclone can help determine the cyclone's intensity.[78]
Acidity

The phrase acid rain was first used by Scottish chemist Robert Augus Smith in 1852.[79] The pH of rain varies, especially due to its origin. On America's East Coast, rain that is derived from the Atlantic Ocean typically has a pH of 5.0-5.6; rain that comes across the continental from the west has a pH of 3.8-4.8; and local thunderstorms can have a pH as low as 2.0.[80] Rain becomes acidic primarily due to the presence of two strong acids, sulfuric acid (H2SO4) and nitric acid (HNO3). Sulfuric acid is derived from natural sources such as volcanoes, and wetlands (sulfate reducing bacteria); and anthropogenic sources such as the combustion of fossil fuels, and mining where H2S is present. Nitric acid is produced by natural sources such as lightning, soil bacteria, and natural fires; while also produced anthropogenically by the combustion of fossil fuels and from power plants. In the past 20 years the concentrations of nitric and sulfuric acid has decreased in presence of rainwater, which may be due to the significant increase in ammonium (most likely as ammonia from livestock production), which acts as a buffer in acid rain and raises the pH.[81]
Köppen climate classification
.svg.png)
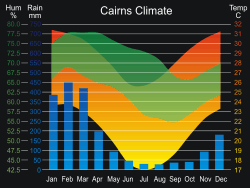
The Köppen classification depends on average monthly values of temperature and precipitation. The most commonly used form of the Köppen classification has five primary types labeled A through E. Specifically, the primary types are A, tropical; B, dry; C, mild mid-latitude; D, cold mid-latitude; and E, polar. The five primary classifications can be further divided into secondary classifications such as rain forest, monsoon, tropical savanna, humid subtropical, humid continental, oceanic climate, Mediterranean climate, steppe, subarctic climate, tundra, polar ice cap, and desert.
Rain forests are characterized by high rainfall, with definitions setting minimum normal annual rainfall between 1,750 and 2,000 mm (69 and 79 in).[82] A tropical savanna is a grassland biome located in semi-arid to semi-humid climate regions of subtropical and tropical latitudes, with rainfall between 750 and 1,270 mm (30 and 50 in) a year. They are widespread on Africa, and are also found in India, the northern parts of South America, Malaysia, and Australia.[83] The humid subtropical climate zone where winter rainfall is associated with large storms that the westerlies steer from west to east. Most summer rainfall occurs during thunderstorms and from occasional tropical cyclones.[84] Humid subtropical climates lie on the east side continents, roughly between latitudes 20° and 40° degrees away from the equator.[85]
An oceanic (or maritime) climate is typically found along the west coasts at the middle latitudes of all the world's continents, bordering cool oceans, as well as southeastern Australia, and is accompanied by plentiful precipitation year-round.[86] The Mediterranean climate regime resembles the climate of the lands in the Mediterranean Basin, parts of western North America, parts of Western and South Australia, in southwestern South Africa and in parts of central Chile. The climate is characterized by hot, dry summers and cool, wet winters.[87] A steppe is a dry grassland.[88] Subarctic climates are cold with continuous permafrost and little precipitation.[89]
Measurement
Gauges

Rain is measured in units of length per unit time, typically in millimeters per hour,[90] or in countries where imperial units are more common, inches per hour.[91] The "length", or more accurately, "depth" being measured is the depth of rain water that would accumulate on a flat, horizontal and impermeable surface during a given amount of time, typically an hour.[92] One millimeter of rainfall is the equivalent of one liter of water per square meter.[93]
The standard way of measuring rainfall or snowfall is the standard rain gauge, which can be found in 100-mm (4-in) plastic and 200-mm (8-in) metal varieties.[94] The inner cylinder is filled by 25 mm (0.98 in) of rain, with overflow flowing into the outer cylinder. Plastic gauges have markings on the inner cylinder down to 0.25 mm (0.0098 in) resolution, while metal gauges require use of a stick designed with the appropriate 0.25 mm (0.0098 in) markings. After the inner cylinder is filled, the amount inside it is discarded, then filled with the remaining rainfall in the outer cylinder until all the fluid in the outer cylinder is gone, adding to the overall total until the outer cylinder is empty.[95] Other types of gauges include the popular wedge gauge (the cheapest rain gauge and most fragile), the tipping bucket rain gauge, and the weighing rain gauge.[96] For those looking to measure rainfall the most inexpensively, a can that is cylindrical with straight sides will act as a rain gauge if left out in the open, but its accuracy will depend on what ruler is used to measure the rain with. Any of the above rain gauges can be made at home, with enough know-how.[97]
When a precipitation measurement is made, various networks exist across the United States and elsewhere where rainfall measurements can be submitted through the Internet, such as CoCoRAHS or GLOBE.[98][99] If a network is not available in the area where one lives, the nearest local weather or met office will likely be interested in the measurement.[100]
Remote sensing
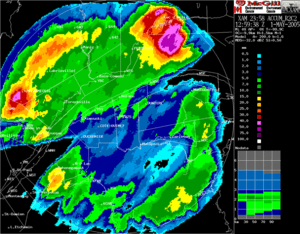
One of the main uses of weather radar is to be able to assess the amount of precipitations fallen over large basins for hydrological purposes.[101] For instance, river flood control, sewer management and dam construction are all areas where planners use rainfall accumulation data. Radar-derived rainfall estimates compliment surface station data which can be used for calibration. To produce radar accumulations, rain rates over a point are estimated by using the value of reflectivity data at individual grid points. A radar equation is then used, which is,
- ,

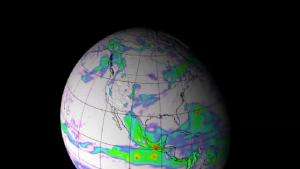
where Z represents the radar reflectivity, R represents the rainfall rate, and A and b are constants.[102] Satellite derived rainfall estimates use passive microwave instruments aboard polar orbiting as well as geostationary weather satellites to indirectly measure rainfall rates.[103] If one wants an accumulated rainfall over a time period, one has to add up all the accumulations from each grid box within the images during that time.

Intensity
|
Heavy rain in Glenshaw, Pennsylvania
 The sound of a heavy rain fall in suburban neighborhood |
| Problems playing this file? See media help. | |
Rainfall intensity is classified according to the rate of precipitation:
- Light rain — when the precipitation rate is < 2.5 mm (0.098 in) per hour
- Moderate rain — when the precipitation rate is between 2.5 mm (0.098 in) - 7.6 mm (0.30 in) or 10 mm (0.39 in) per hour[104][105]
- Heavy rain — when the precipitation rate is > 7.6 mm (0.30 in) per hour,[104] or between 10 mm (0.39 in) and 50 mm (2.0 in) per hour[105]
- Violent rain — when the precipitation rate is > 50 mm (2.0 in) per hour[105]
Euphemisms for a heavy or violent rain include gully washer, trash-mover and toad-strangler.[106] The intensity can also be expressed by rainfall erosivity. R-factor[107]
Return period
The likelihood or probability of an event with a specified intensity and duration, is called the return period or frequency.[108] The intensity of a storm can be predicted for any return period and storm duration, from charts based on historic data for the location.[109] The term 1 in 10 year storm describes a rainfall event which is rare and is only likely to occur once every 10 years, so it has a 10 percent likelihood any given year. The rainfall will be greater and the flooding will be worse than the worst storm expected in any single year. The term 1 in 100 year storm describes a rainfall event which is extremely rare and which will occur with a likelihood of only once in a century, so has a 1 percent likelihood in any given year. The rainfall will be extreme and flooding to be worse than a 1 in 10 year event. As with all probability events, it is possible, though improbable, to have multiple "1 in 100 Year Storms" in a single year.[110]
Forecasting
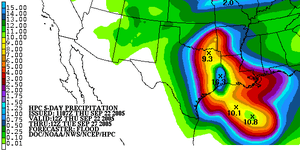
The Quantitative Precipitation Forecast (abbreviated QPF) is the expected amount of liquid precipitation accumulated over a specified time period over a specified area.[111] A QPF will be specified when a measurable precipitation type reaching a minimum threshold is forecast for any hour during a QPF valid period. Precipitation forecasts tend to be bound by synoptic hours such as 0000, 0600, 1200 and 1800 GMT. Terrain is considered in QPFs by use of topography or based upon climatological precipitation patterns from observations with fine detail.[112] Starting in the mid to late 1990s, QPFs were used within hydrologic forecast models to simulate impact to rivers throughout the United States.[113] Forecast models show significant sensitivity to humidity levels within the planetary boundary layer, or in the lowest levels of the atmosphere, which decreases with height.[114] QPF can be generated on a quantitative, forecasting amounts, or a qualitative, forecasting the probability of a specific amount, basis.[115] Radar imagery forecasting techniques show higher skill than model forecasts within 6 to 7 hours of the time of the radar image. The forecasts can be verified through use of rain gauge measurements, weather radar estimates, or a combination of both. Various skill scores can be determined to measure the value of the rainfall forecast.[116]
Impact
Effect on agriculture

Precipitation, especially rain, has a dramatic effect on agriculture. All plants need at least some water to survive, therefore rain (being the most effective means of watering) is important to agriculture. While a regular rain pattern is usually vital to healthy plants, too much or too little rainfall can be harmful, even devastating to crops. Drought can kill crops and increase erosion,[117] while overly wet weather can cause harmful fungus growth.[118] Plants need varying amounts of rainfall to survive. For example, certain cacti require small amounts of water,[119] while tropical plants may need up to hundreds of inches of rain per year to survive.
In areas with wet and dry seasons, soil nutrients diminish and erosion increases during the wet season.[27] Animals have adaptation and survival strategies for the wetter regime. The previous dry season leads to food shortages into the wet season, as the crops have yet to mature.[120] Developing countries have noted that their populations show seasonal weight fluctuations due to food shortages seen before the first harvest, which occurs late in the wet season.[121] Rain may be harvested through the use of rainwater tanks; treated to potable use or for non-potable use indoors or for irrigation.[122] Excessive rain during short periods of time can cause flash floods.[123]
In culture
Cultural attitudes towards rain differ across the world. In temperate climates, people tend to be more stressed when the weather is unstable or cloudy, with its impact greater on men than women.[124] Rain can also bring joy, as some consider it to be soothing or enjoy the aesthetic appeal of it. In dry places, such as India,[125] or during periods of drought,[126] rain lifts people's moods. In Botswana, the Setswana word for rain, pula, is used as the name of the national currency, in recognition of the economic importance of rain in this desert country.[127] Several cultures have developed means of dealing with rain and have developed numerous protection devices such as umbrellas and raincoats, and diversion devices such as gutters and storm drains that lead rains to sewers.[128] Many people find the scent during and immediately after rain pleasant or distinctive. The source of this scent is petrichor, an oil produced by plants, then absorbed by rocks and soil, and later released into the air during rainfall.[129]
Global climatology
Approximately 505,000 km3 (121,000 cu mi) of water falls as precipitation each year across the globe with 398,000 km3 (95,000 cu mi) of it over the oceans.[130] Given the Earth's surface area, that means the globally averaged annual precipitation is 990 mm (39 in). Deserts are defined as areas with an average annual precipitation of less than 250 mm (10 in) per year,[131][132] or as areas where more water is lost by evapotranspiration than falls as precipitation.[133]
Deserts
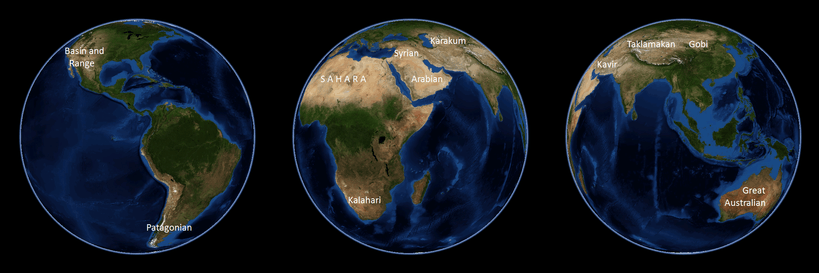
The northern half of Africa is occupied by the world's most extensive hot, dry region, the Sahara Desert. Some deserts are also occupying much of southern Africa : the Namib and the Kalahari. Across Asia, a large annual rainfall minimum, composed primarily of deserts, stretches from the Gobi Desert in Mongolia west-southwest through western Pakistan (Balochistan) and Iran into the Arabian Desert in Saudi Arabia. Most of Australia is semi-arid or desert,[134] making it the world's driest inhabited continent. In South America, the Andes mountain range blocks Pacific moisture that arrives in that continent, resulting in a desertlike climate just downwind across western Argentina.[48] The drier areas of the United States are regions where the Sonoran Desert overspreads the Desert Southwest, the Great Basin and central Wyoming.[135]

Polar desert
Since rain only falls as liquid, in frozen temperatures, rain cannot fall. As a result, very cold climates see very little rainfall and are often known as polar deserts. A common biome in this area is the tundra which has a short summer thaw and a long frozen winter. Ice caps see no rain at all, making Antarctica the world's driest continent.
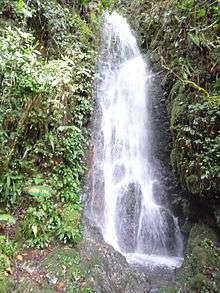
Rainforests
Rainforests are areas of the world with very high rainfall. Both tropical and temperate rainforests exist. Tropical rainforests occupy a large band of the planet mostly along the equator. Most temperate rainforests are located on mountainous west coasts between 45 and 55 degrees latitude, but they are often found in other areas.
Around 40-75% of all biotic life is found in rainforests. Rainforests are also responsible for 28% of the world's oxygen turnover.
Monsoons
The equatorial region near the Intertropical Convergence Zone (ITCZ), or monsoon trough, is the wettest portion of the world's continents. Annually, the rain belt within the tropics marches northward by August, then moves back southward into the Southern Hemisphere by February and March.[136] Within Asia, rainfall is favored across its southern portion from India east and northeast across the Philippines and southern China into Japan due to the monsoon advecting moisture primarily from the Indian Ocean into the region.[137] The monsoon trough can reach as far north as the 40th parallel in East Asia during August before moving southward thereafter. Its poleward progression is accelerated by the onset of the summer monsoon which is characterized by the development of lower air pressure (a thermal low) over the warmest part of Asia.[138][139] Similar, but weaker, monsoon circulations are present over North America and Australia.[140][141] During the summer, the Southwest monsoon combined with Gulf of California and Gulf of Mexico moisture moving around the subtropical ridge in the Atlantic Ocean bring the promise of afternoon and evening thunderstorms to the southern tier of the United States as well as the Great Plains.[142] The eastern half of the contiguous United States east of the 98th meridian, the mountains of the Pacific Northwest, and the Sierra Nevada range are the wetter portions of the nation, with average rainfall exceeding 760 mm (30 in) per year.[143] Tropical cyclones enhance precipitation across southern sections of the United States,[144] as well as Puerto Rico, the United States Virgin Islands,[145] the Northern Mariana Islands,[146] Guam, and American Samoa.
Impact of the Westerlies

Westerly flow from the mild north Atlantic leads to wetness across western Europe, in particular Ireland and the United Kingdom, where the western coasts can receive between 1,000 mm (39 in), at sea-level and 2,500 mm (98 in), on the mountains of rain per year. Bergen, Norway is one of the more famous European rain-cities with its yearly precipitation of 2,250 mm (89 in) on average. During the fall, winter, and spring, Pacific storm systems bring most of Hawaii and the western United States much of their precipitation.[142] Over the top of the ridge, the jet stream brings a summer precipitation maximum to the Great Lakes. Large thunderstorm areas known as mesoscale convective complexes move through the Plains, Midwest, and Great Lakes during the warm season, contributing up to 10% of the annual precipitation to the region.[147]
The El Niño-Southern Oscillation affects the precipitation distribution, by altering rainfall patterns across the western United States,[148] Midwest,[149][150] the Southeast,[151] and throughout the tropics. There is also evidence that global warming is leading to increased precipitation to the eastern portions of North America, while droughts are becoming more frequent in the tropics and subtropics.
Wettest known locations
Cherrapunji, situated on the southern slopes of the Eastern Himalaya in Shillong, India is the confirmed wettest place on Earth, with an average annual rainfall of 11,430 mm (450 in). The highest recorded rainfall in a single year was 22,987 mm (905.0 in) in 1861. The 38-year average at nearby Mawsynram, Meghalaya, India is 11,873 mm (467.4 in).[152] The wettest spot in Australia is Mount Bellenden Ker in the north-east of the country which records an average of 8,000 mm (310 in) per year, with over 12,200 mm (480.3 in) of rain recorded during 2000.[153] Mount Waiʻaleʻale on the island of Kauaʻi in the Hawaiian Islands averages more than 12,000 mm (460 in)[154] of rain per year over the last 32 years, with a record 17,340 mm (683 in) in 1982. Its summit is considered one of the rainiest spots on earth. It has been promoted in tourist literature for many years as the wettest spot in the world.[155] Lloró, a town situated in Chocó, Colombia, is probably the place with the largest rainfall in the world, averaging 13,300 mm (523.6 in) per year.[154] The Department of Chocó is extraordinarily humid. Tutunendaó, a small town situated in the same department, is one of the wettest estimated places on Earth, averaging 11,394 mm (448.6 in) per year; in 1974 the town received 26,303 mm (86 ft 3.6 in), the largest annual rainfall measured in Colombia. Unlike Cherrapunji, which receives most of its rainfall between April and September, Tutunendaó receives rain almost uniformly distributed throughout the year.[156] Quibdó, the capital of Chocó, receives the most rain in the world among cities with over 100,000 inhabitants: 9,000 mm (354 in) per year.[154] Storms in Chocó can drop 500 mm (20 in) of rainfall in a day. This amount is more than what falls in many cities in a year's time.
| Continent | Highest average | Place | Elevation | Years of record | ||
|---|---|---|---|---|---|---|
| in | mm | ft | m | |||
| South America | 523.6 | 13,299 | Lloró, Colombia (estimated)[a][b] | 520 | 158[c] | 29 |
| Asia | 467.4 | 11,872 | Mawsynram, India[a][d] | 4,597 | 1,401 | 39 |
| Oceania | 460.0 | 11,684 | Mount Waiʻaleʻale, Kauai, Hawaii (USA)[a] | 5,148 | 1,569 | 30 |
| Africa | 405.0 | 10,287 | Debundscha, Cameroon | 30 | 9.1 | 32 |
| South America | 354.0 | 8,992 | Quibdo, Colombia | 120 | 36.6 | 16 |
| Australia | 340.0 | 8,636 | Mount Bellenden Ker, Queensland | 5,102 | 1,555 | 9 |
| North America | 256.0 | 6,502 | Henderson Lake, British Columbia | 12 | 3.66 | 14 |
| Europe | 183.0 | 4,648 | Crkvice, Montenegro | 3,337 | 1,017 | 22 |
| Source (without conversions): Global Measured Extremes of Temperature and Precipitation, National Climatic Data Center. August 9, 2004.[157] | ||||||
| Continent | Place | Highest rainfall | ||
|---|---|---|---|---|
| in | mm | |||
| Highest average annual rainfall[158] | Asia | Mawsynram, India | 467.4 | 11,870 |
| Highest in one year[158] | Asia | Cherrapunji, India | 1,042 | 26,470 |
| Highest in one calendar month[159] | Asia | Cherrapunji, India | 366 | 9,296 |
| Highest in 24 hours[158] | Indian Ocean | Foc Foc, La Reunion Island | 71.8 | 1,820 |
| Highest in 12 hours[158] | Indian Ocean | Foc Foc, La Reunion Island | 45.0 | 1,140 |
| Highest in one minute[158] | North America | Unionville, Maryland, USA | 1.23 | 31.2 |
Outside of Earth
On Titan, Saturn's largest natural satellite, infrequent methane rain is thought to carve the moon's numerous surface channels.[160] On Venus, sulfuric acid virga evaporates 25 km (16 mi) from the surface.[161] There is likely to be rain of various compositions in the upper atmospheres of the gas giants, as well as precipitation of liquid neon in the deep atmospheres.[162][163] Extrasolar planet OGLE-TR-56b in the constellation Sagittarius is hypothesized to have iron rain.[164]
See also
- Precipitation types
- Rain dust
- Rain sensor
- Rainbow
- Raining animals
- Red rain in Kerala
- Petrichor - the cause of the scent during and after rain
- Sanitary sewer overflow
- Sediment precipitation
- Water resources
- Weather
- Rainmaking
- Johad
- John Rainwater - pseudonymous mathematician
Notes
- a b c The value given is continent's highest and possibly the world's depending on measurement practices, procedures and period of record variations.
- ^ The official greatest average annual precipitation for South America is 900 cm (354 in) at Quibdó, Colombia. The 1,330 cm (523.6 in) average at Lloró [23 km (14 mi) SE and at a higher elevation than Quibdó] is an estimated amount.
- ^ Approximate elevation.
- ^ Recognized as "The Wettest place on Earth" by the Guinness Book of World Records.[165]
References
- ↑ "The Water Cycle". Planetguide.net. Retrieved 2011-12-26.
- ↑ Steve Kempler (2009). "Parameter information page". NASA Goddard Space Flight Center. Archived from the original on November 26, 2007. Retrieved 2008-12-27.
- ↑ Mark Stoelinga (2005-09-12). Atmospheric Thermodynamics (PDF). University of Washington. p. 80. Retrieved 2010-01-30.
- ↑ Glossary of Meteorology (June 2000). "Relative Humidity". American Meteorological Society. Retrieved 2010-01-29.
- ↑ Glossary of Meteorology (June 2000). "Cloud". American Meteorological Society. Retrieved 2010-01-29.
- ↑ Naval Meteorology and Oceanography Command (2007). "Atmospheric Moisture". United States Navy. Archived from the original on January 14, 2009. Retrieved 2008-12-27.
- ↑ Glossary of Meteorology (2009). "Adiabatic Process". American Meteorological Society. Retrieved 2008-12-27.
- ↑ TE Technology, Inc (2009). "Peltier Cold Plate". Retrieved 2008-12-27.
- ↑ Glossary of Meteorology (2009). "Radiational cooling". American Meteorological Society. Retrieved 2008-12-27.
- ↑ Robert Fovell (2004). "Approaches to saturation" (PDF). University of California in Los Angelese. Retrieved 2009-02-07.
- ↑ Robert Penrose Pearce (2002). Meteorology at the Millennium. Academic Press. p. 66. ISBN 978-0-12-548035-2. Retrieved 2009-01-02.
- ↑ National Weather Service Office, Spokane, Washington (2009). "Virga and Dry Thunderstorms". Retrieved 2009-01-02.
- ↑ Bart van den Hurk & Eleanor Blyth (2008). "Global maps of Local Land-Atmosphere coupling" (PDF). KNMI. Retrieved 2009-01-02.
- ↑ Krishna Ramanujan & Brad Bohlander (2002). "Landcover changes may rival greenhouse gases as cause of climate change". National Aeronautics and Space Administration Goddard Space Flight Center. Archived from the original on June 3, 2008. Retrieved 2009-01-02.
- ↑ National Weather Service JetStream (2008). "Air Masses". Retrieved 2009-01-02.
- 1 2 Michael Pidwirny (2008). "CHAPTER 8: Introduction to the Hydrosphere (e). Cloud Formation Processes". Physical Geography. Retrieved 2009-01-01.
- ↑ Glossary of Meteorology (June 2000). "Front". American Meteorological Society. Retrieved 2010-01-29.
- ↑ David Roth. "Unified Surface Analysis Manual" (PDF). Hydrometeorological Prediction Center. Retrieved 2006-10-22.
- ↑ FMI (2007). "Fog And Stratus - Meteorological Physical Background". Zentralanstalt für Meteorologie und Geodynamik. Retrieved 2009-02-07.
- ↑ Glossary of Meteorology (June 2000). "Warm Rain Process". American Meteorological Society. Retrieved 2010-01-15.
- ↑ Paul Sirvatka (2003). "Cloud Physics: Collision/Coalescence; The Bergeron Process". College of DuPage. Retrieved 2009-01-01.
- ↑ Alistair B. Fraser (2003-01-15). "Bad Meteorology: Raindrops are shaped like teardrops.". Pennsylvania State University. Retrieved 2008-04-07.
- 1 2 3 4 Emmanuel Villermaux, Benjamin Bossa; Bossa (September 2009). "Single-drop fragmentation distribution of raindrops" (PDF). Nature Physics. 5 (9): 697–702. Bibcode:2009NatPh...5..697V. doi:10.1038/NPHYS1340. Lay summary.
- ↑ United States Geological Survey (2009). "Are raindrops tear shaped?". United States Department of the Interior. Retrieved 2008-12-27.
- ↑ Paul Rincon (2004-07-16). "Monster raindrops delight experts". British Broadcasting Company. Retrieved 2009-11-30.
- ↑ Norman W. Junker (2008). "An ingredients based methodology for forecasting precipitation associated with MCS's". Hydrometeorological Prediction Center. Retrieved 2009-02-07.
- 1 2 3 J. S. Oguntoyinbo & F. O. Akintola (1983). "Rainstorm characteristics affecting water availability for agriculture" (PDF). IAHS Publication Number 140. Retrieved 2008-12-27.
- ↑ Robert A. Houze Jr (October 1997). "Stratiform Precipitation in Regions of Convection: A Meteorological Paradox?" (PDF). Bulletin of the American Meteorological Society. 78 (10): 2179–2196. Bibcode:1997BAMS...78.2179H. doi:10.1175/1520-0477(1997)078<2179:SPIROC>2.0.CO;2. ISSN 1520-0477. Retrieved 2008-12-27.
- ↑ Marshall, J. S.; Palmer, W. M. (1948). "The distribution of raindrops with size". J. Meteorol. 5 (4): 165–166. Bibcode:1948JAtS....5..165M. doi:10.1175/1520-0469(1948)005<0165:tdorws>2.0.co;2.
- ↑ Houze Robert A.; Hobbs Peter V.; Herzegh Paul H.; Parsons David B. (1979). "Size Distributions of Precipitation Particles in Frontal Clouds". J. Atmos. Sci. 36: 156–162. Bibcode:1979JAtS...36..156H. doi:10.1175/1520-0469(1979)036<0156:SDOPPI>2.0.CO;2.
- ↑ Niu, Shengjie; Jia, Xingcan; Sang, Jianren; Liu, Xiaoli; Lu, Chunsong; Liu, Yangang (2010). "Distributions of Raindrop Sizes and Fall Velocities in a Semiarid Plateau Climate: Convective versus Stratiform Rains". J. Appl. Meteor. Climatol. 49 (4): 632–645. Bibcode:2010JApMC..49..632N. doi:10.1175/2009JAMC2208.1.
- ↑ "Falling raindrops hit 5 to 20 mph speeds". USA Today. 2001-12-19. Retrieved 2013-12-22.
- ↑ van der Westhuizen W.A.; Grobler N.J.; Loock J.C.; Tordiffe E.A.W. "Raindrop imprints in the Late Archaean-Early Proterozoic Ventersdorp Supergroup, South Africa". Sedimentary Geology. 61 (3–4): 303–309. Bibcode:1989SedG...61..303V. doi:10.1016/0037-0738(89)90064-X.
- ↑ Som, Sanjoy M.; Catling, David C.; Harnmeijer, Jelte P.; Polivka, Peter M.; Buick, Roger (2012). "Air density 2.7 billion years ago limited to less than twice modern levels by fossil raindrop imprints". Nature. 484 (7394): 359–362. Bibcode:2012Natur.484..359S. doi:10.1038/nature10890. PMID 22456703.
- ↑ Andrea Prosperetti & Hasan N. Oguz (1993). "The impact of drops on liquid surfaces and the underwater noise of rain" (PDF). Annual Review of Fluid Mechanics. 25: 577–602. Bibcode:1993AnRFM..25..577P. doi:10.1146/annurev.fl.25.010193.003045. Retrieved 2006-12-09.
- ↑ Ryan C. Rankin (June 2005). "Bubble Resonance". The Physics of Bubbles, Antibubbles, and all That. Retrieved 2006-12-09.
- ↑ Alaska Air Flight Service Station (2007-04-10). "SA-METAR". Federal Aviation Administration. Archived from the original on June 3, 2009. Retrieved 2009-08-29.
- 1 2 B. Geerts (2002). "Convective and stratiform rainfall in the tropics". University of Wyoming. Retrieved 2007-11-27.
- ↑ David Roth (2006). "Unified Surface Analysis Manual" (PDF). Hydrometeorological Prediction Center. Retrieved 2006-10-22.
- ↑ MetEd (2003-03-14). "Precipitation Type Forecasts in the Southeastern and Mid-Atlantic states". University Corporation for Atmospheric Research. Retrieved 2010-01-30.
- ↑ "Meso-Analyst Severe Weather Guide" (PDF). National Oceanic and Atmospheric Administration. Retrieved 2013-12-22.
- ↑ Robert Houze (October 1997). "Stratiform Precipitation in Regions of Convection: A Meteorological Paradox?". Bulletin of the American Meteorological Society. 78 (10): 2179–2196. Bibcode:1997BAMS...78.2179H. doi:10.1175/1520-0477(1997)078<2179:SPIROC>2.0.CO;2. ISSN 1520-0477.
- ↑ Glossary of Meteorology (2009). "Graupel". American Meteorological Society. Retrieved 2009-01-02.
- ↑ Toby N. Carlson (1991). Mid-latitude Weather Systems. Routledge. p. 216. ISBN 978-0-04-551115-0. Retrieved 2009-02-07.
- ↑ Diana Leone (2002). "Rain supreme". Honolulu Star-Bulletin. Retrieved 2008-03-19.
- ↑ Steven Businger and Thomas Birchard, Jr. A Bow Echo and Severe Weather Associated with a Kona Low in Hawaii. Retrieved on 2007-05-22.
- ↑ Western Regional Climate Center (2002). "Climate of Hawaii". Retrieved 2008-03-19.
- 1 2 Paul E. Lydolph (1985). The Climate of the Earth. Rowman & Littlefield. p. 333. ISBN 978-0-86598-119-5. Retrieved 2009-01-02.
- ↑ Michael A. Mares (1999). Encyclopedia of Deserts. University of Oklahoma Press. p. 252. ISBN 978-0-8061-3146-7. Retrieved 2009-01-02.
- ↑ Adam Ganson (2003). "Geology of Death Valley". Indiana University. Retrieved 2009-02-07.
- ↑ Glossary of Meteorology (2009). "Rainy season". American Meteorological Society. Retrieved 2008-12-27.
- ↑ Costa Rica Guide (2005). "When to Travel to Costa Rica". ToucanGuides. Retrieved 2008-12-27.
- ↑ Michael Pidwirny (2008). "CHAPTER 9: Introduction to the Biosphere". PhysicalGeography.net. Retrieved 2008-12-27.
- ↑ Elisabeth M. Benders-Hyde (2003). "World Climates". Blue Planet Biomes. Retrieved 2008-12-27.
- ↑ Mei Zheng (2000). "The sources and characteristics of atmospheric particulates during the wet and dry seasons in Hong Kong". University of Rhode Island. Retrieved 2008-12-27.
- ↑ S. I. Efe; F. E. Ogban; M. J. Horsfall; E. E. Akporhonor (2005). "Seasonal Variations of Physico-chemical Characteristics in Water Resources Quality in Western Niger Delta Region, Nigeria" (PDF). Journal of Applied Scientific Environmental Management. 9 (1): 191–195. ISSN 1119-8362. Retrieved 2008-12-27.
- ↑ C. D. Haynes; M. G. Ridpath; M. A. J. Williams (1991). Monsoonal Australia. Taylor & Francis. p. 90. ISBN 978-90-6191-638-3. Retrieved 2008-12-27.
- ↑ Chris Landsea (2007). "Subject: D3) Why do tropical cyclones' winds rotate counter-clockwise (clockwise) in the Northern (Southern) Hemisphere?". National Hurricane Center. Retrieved 2009-01-02.
- ↑ Climate Prediction Center (2005). "2005 Tropical Eastern North Pacific Hurricane Outlook". National Oceanic and Atmospheric Administration. Retrieved 2006-05-02.
- ↑ Jack Williams (2005-05-17). "Background: California's tropical storms". USA Today. Retrieved 2009-02-07.
- ↑ R. S. Cerveny & R. C. Balling (1998-08-06). "Weekly cycles of air pollutants, precipitation and tropical cyclones in the coastal NW Atlantic region". Nature. 394 (6693): 561–563. Bibcode:1998Natur.394..561C. doi:10.1038/29043.
- ↑ Dale Fuchs (2005-06-28). "Spain goes hi-tech to beat drought". London: The Guardian. Retrieved 2007-08-02.
- ↑ Goddard Space Flight Center (2002-06-18). "NASA Satellite Confirms Urban Heat Islands Increase Rainfall Around Cities". National Aeronautics and Space Administration. Archived from the original on June 12, 2008. Retrieved 2009-07-17.
- ↑ Climate Change Division (2008-12-17). "Precipitation and Storm Changes". United States Environmental Protection Agency. Retrieved 2009-07-17.
- ↑ Central, Climate. "Heaviest Downpours Rise across the U.S.". Retrieved 2015-05-28.
- ↑ "Across U.S., Heaviest Downpours On The Rise | Climate Central". www.climatecentral.org. Retrieved 2015-05-28.
- ↑ American Meteorological Society (1998-10-02). "Planned and Inadvertent Weather Modification". Retrieved 2010-01-31.
- ↑ Glossary of Meteorology (2009). Rainband. Retrieved on 2008-12-24.
- ↑ Glossary of Meteorology (2009). Banded structure. Retrieved on 2008-12-24.
- ↑ Owen Hertzman (1988). Three-Dimensional Kinematics of Rainbands in Midlatitude Cyclones. Retrieved on 2008-12-24
- ↑ Yuh-Lang Lin (2007). Mesoscale Dynamics. Retrieved on 2008-12-25.
- ↑ Glossary of Meteorology (2009). Prefrontal squall line. Retrieved on 2008-12-24.
- ↑ J. D. Doyle (1997). The influence of mesoscale orography on a coastal jet and rainband. Retrieved on 2008-12-25.
- ↑ A. Rodin (1995). Interaction of a cold front with a sea-breeze front numerical simulations. Retrieved on 2008-12-25.
- ↑ St. Louis University (2003-08-04). "What is a TROWAL? via the Internet Wayback Machine". Archived from the original on 2006-09-16. Retrieved 2006-11-02.
- ↑ David R. Novak, Lance F. Bosart, Daniel Keyser, and Jeff S. Waldstreicher (2002). A Climatological and composite study of cold season banded precipitation in the Northeast United States. Retrieved on 2008-12-26.
- ↑ Ivory J. Small (1999). An observation study of island effect bands: precipitation producers in Southern California. Retrieved on 2008-12-26.
- ↑ University of Wisconsin–Madison (1998).Objective Dvorak Technique. Retrieved on 2006-05-29.
- ↑ Encyclopedia Britannica
- ↑ Joan D. Willey; Bennett; Williams; Denne; Kornegay; Perlotto; Moore (January 1988). "Effect of storm type on rainwater composition in southeastern North Carolina". Environmental Science & Technology. Environmental Science & Technology. 22: 41–46. Bibcode:1988EnST...22...41W. doi:10.1021/es00166a003.
- ↑ Joan D. Willey; Kieber; Avery (2006-08-19). "Changing Chemical Composition of Precipitation in Wilmington, North Carolina, U.S.A.: Implications for the Continental U.S.A". Environmental Science & Technology. Environmental Science & Technology. 40 (18): 5675–5680. Bibcode:2006EnST...40.5675W. doi:10.1021/es060638w.
- ↑ Susan Woodward (1997-10-29). "Tropical Broadleaf Evergreen Forest: The Rainforest". Radford University. Retrieved 2008-03-14.
- ↑ Susan Woodward (2005-02-02). "Tropical Savannas". Radford University. Retrieved 2008-03-16.
- ↑ "Humid subtropical climate". Encyclopædia Britannica. Encyclopædia Britannica Online. 2008. Retrieved 2008-05-14.
- ↑ Michael Ritter (2008-12-24). "Humid Subtropical Climate". University of Wisconsin–Stevens Point. Retrieved 2008-03-16.
- ↑ Lauren Springer Ogden (2008). Plant-Driven Design. Timber Press. p. 78. ISBN 978-0-88192-877-8.
- ↑ Michael Ritter (2008-12-24). "Mediterranean or Dry Summer Subtropical Climate". University of Wisconsin–Stevens Point. Retrieved 2009-07-17.
- ↑ Brynn Schaffner & Kenneth Robinson (2003-06-06). "Steppe Climate". West Tisbury Elementary School. Retrieved 2008-04-15.
- ↑ Michael Ritter (2008-12-24). "Subarctic Climate". University of Wisconsin–Stevens Point. Retrieved 2008-04-16.
- ↑ http://www.wmo.int/pages/prog/www/IMOP/publications/CIMO-Guide/CIMO%20Guide%207th%20Edition,%202008/Part%20I/Chapter%206.pdf
- ↑ "Chapter 5 - Principal Hazards in U.S.doc". p. 128.
- ↑ Rain gauge and cubic inches
- ↑ "FAO.org". FAO.org. Retrieved 2011-12-26.
- ↑ National Weather Service Office, Northern Indiana (2009). "8 Inch Non-Recording Standard Rain Gauge". Retrieved 2009-01-02.
- ↑ Chris Lehmann (2009). "10/00". Central Analytical Laboratory. Retrieved 2009-01-02.
- ↑ National Weather Service (2009). "Glossary: W". Retrieved 2009-01-01.
- ↑ Discovery School (2009). "Build Your Own Weather Station". Discovery Education. Archived from the original on 2008-12-26. Retrieved 2009-01-02.
- ↑ "Community Collaborative Rain, Hail & Snow Network Main Page". Colorado Climate Center. 2009. Retrieved 2009-01-02.
- ↑ The Globe Program (2009). "Global Learning and Observations to Benefit the Environment Program". Retrieved 2009-01-02.
- ↑ National Weather Service (2009). "NOAA's National Weather Service Main Page". Retrieved 2009-01-01.
- ↑ Kang-Tsung Chang, Jr-Chuan Huang; Shuh-Ji Kao & Shou-Hao Chiang (2009). "Radar Rainfall Estimates for Hydrologic and Landslide Modeling". Data Assimilation for Atmospheric, Oceanic and Hydrologic Applications: 127–145. doi:10.1007/978-3-540-71056-1_6. ISBN 978-3-540-71056-1. Retrieved 2010-01-15.
- ↑ Eric Chay Ware (August 2005). "Corrections to Radar-Estimated Precipitation Using Observed Rain Gauge Data: A Thesis" (PDF). Cornell University. p. 1. Retrieved 2010-01-02.
- ↑ Pearl Mngadi; Petrus JM Visser & Elizabeth Ebert (October 2006). "Southern Africa Satellite Derived Rainfall Estimates Validation" (PDF). International Precipitation Working Group. p. 1. Retrieved 2010-01-05.
- 1 2 Glossary of Meteorology (June 2000). "Rain". American Meteorological Society. Retrieved 2010-01-15.
- 1 2 3 Met Office (August 2007). "Fact Sheet No. 3: Water in the Atmosphere" (PDF). Crown Copyright. p. 6. Retrieved 2011-05-12.
- ↑ Gullywasher | Define Gullywasher at Dictionary.com
- ↑ "Rainfall erosivity in Europe". Science of The Total Environment. 511: 801–814. doi:10.1016/j.scitotenv.2015.01.008.
- ↑ Glossary of Meteorology (2009). "Return period". American Meteorological Society. Retrieved 2009-01-02.
- ↑ Glossary of Meteorology (2009). "Rainfall intensity return period". American Meteorological Society. Retrieved 2009-01-02.
- ↑ Boulder Area Sustainability Information Network (2005). "What is a 100 year flood?". Boulder Community Network. Retrieved 2009-01-02.
- ↑ Jack S. Bushong (1999). "Quantitative Precipitation Forecast: Its Generation and Verification at the Southeast River Forecast Center" (PDF). University of Georgia. Retrieved 2008-12-31.
- ↑ Daniel Weygand (2008). "Optimizing Output From QPF Helper" (PDF). National Weather Service Western Region. Retrieved 2008-12-31.
- ↑ Noreen O. Schwein (2009). "Optimization of quantitative precipitation forecast time horizons used in river forecasts". American Meteorological Society. Retrieved 2008-12-31.
- ↑ Christian Keil, Andreas Röpnack, George C. Craig, and Ulrich Schumann (2008-12-31). "Sensitivity of quantitative precipitation forecast to height dependent changes in humidity". Geophysical Research Letters. 35 (9): L09812. Bibcode:2008GeoRL..3509812K. doi:10.1029/2008GL033657.
- ↑ Reggiani, P.; Weerts, A. H. (February 2008). "Probabilistic Quantitative Precipitation Forecast for Flood Prediction: An Application". Journal of Hydrometeorology. 9 (1): 76–95. Bibcode:2008JHyMe...9...76R. doi:10.1175/2007JHM858.1. Retrieved 2008-12-31.
- ↑ Charles Lin (2005). "Quantitative Precipitation Forecast (QPF) from Weather Prediction Models and Radar Nowcasts, and Atmospheric Hydrological Modelling for Flood Simulation" (PDF). Achieving Technological Innovation in Flood Forecasting Project. Retrieved 2009-01-01.
- ↑ Bureau of Meteorology (2010). "Living With Drought". Commonwealth of Australia. Retrieved 2010-01-15.
- ↑ Robert Burns (2007-06-06). "Texas Crop and Weather". Texas A&M University. Retrieved 2010-01-15.
- ↑ James D. Mauseth (2006-07-07). "Mauseth Research: Cacti". University of Texas. Retrieved 2010-01-15.
- ↑ A. Roberto Frisancho (1993). Human Adaptation and Accommodation. University of Michigan Press, pp. 388. ISBN 978-0-472-09511-7. Retrieved on 2008-12-27.
- ↑ Marti J. Van Liere, Eric-Alain D. Ategbo, Jan Hoorweg, Adel P. Den Hartog, and Joseph G. A. J. Hautvast (1994). "The significance of socio-economic characteristics for adult seasonal body-weight fluctuations: a study in north-western Benin" (PDF). British Journal of Nutrition. Cambridge University Press. 72 (3): 479–488. doi:10.1079/BJN19940049. PMID 7947661.
- ↑ Texas Department of Environmental Quality (2008-01-16). "Harvesting, Storing, and Treating Rainwater for Domestic Indoor Use" (PDF). Texas A&M University. Retrieved 2010-01-15.
- ↑ Glossary of Meteorology (June 2000). "Flash Flood". American Meteorological Society. Retrieved 2010-01-15.
- ↑ A. G. Barnston (1986-12-10). "The effect of weather on mood, productivity, and frequency of emotional crisis in a temperate continental climate". International Journal of Biometeorology. 32 (4): 134–143. Bibcode:1988IJBm...32..134B. doi:10.1007/BF01044907. Retrieved 2010-01-15.
- ↑ IANS (2009-03-23). "Sudden spell of rain lifts mood in Delhi". Thaindian news. Retrieved 2010-01-15.
- ↑ William Pack (2009-09-11). "Rain lifts moods of farmers". San Antonio Express-News. Retrieved 2010-01-15.
- ↑ Robyn Cox (2007). "Glossary of Setswana and Other Words". Retrieved 2010-01-15.
- ↑ Allen Burton & Robert Pitt (2002). Stormwater Effects Handbook: A Toolbox for Watershed Managers, Scientists, and Engineers (PDF). CRC Press, LLC. p. 4. Retrieved 2010-01-15.
- ↑ Bear, I.J.; R.G. Thomas (March 1964). "Nature of argillaceous odour". Nature. 201 (4923): 993–995. Bibcode:1964Natur.201..993B. doi:10.1038/201993a0.
- ↑ Chowdhury's Guide to Planet Earth (2005). "The Water Cycle". WestEd. Retrieved 2006-10-24.
- ↑ Publications Service Center (2001-12-18). "What is a desert?". United States Geological Survey. Retrieved 2010-01-15.
- ↑ According to What is a desert?, the 250 mm threshold definition is attributed to Peveril Meigs.
- ↑ "desert". Encyclopædia Britannica online. Retrieved 2008-02-09.
- ↑ "About Biodiversity". Department of the Environment and Heritage. Archived from the original on 2007-02-05. Retrieved 2007-09-18.
- ↑ NationalAtlas.gov (2009-09-17). "Precipitation of the Individual States and of the Conterminous States". United States Department of the Interior. Retrieved 2010-01-15.
- ↑ Todd Mitchell (October 2001). "Africa Rainfall Climatology". University of Washington. Retrieved 2010-01-02.
- ↑ W. Timothy Liu; Xiaosu Xie & Wenqing Tang (2006). "Monsoon, Orography, and Human Influence on Asian Rainfall" (PDF). Proceedings of the First International Symposium in Cloud-prone & Rainy Areas Remote Sensing (CARRS), Chinese University of Hong Kong. National Aeronautic and Space Administration Jet Propulsion Laboratory. Retrieved 2010-01-04.
- ↑ National Centre for Medium Range Forecasting (2004-10-23). "Chapter-II Monsoon-2004: Onset, Advancement and Circulation Features" (PDF). India Ministry of Earth Sciences. Retrieved 2008-05-03.
- ↑ Australian Broadcasting Corporation (1999-08-11). "Monsoon". Retrieved 2008-05-03.
- ↑ David J. Gochis; Luis Brito-Castillo & W. James Shuttleworth (2006-01-10). "Hydroclimatology of the North American Monsoon region in northwest Mexico". Journal of Hydrology. 316 (1–4): 53–70. Bibcode:2006JHyd..316...53G. doi:10.1016/j.jhydrol.2005.04.021. Retrieved 2010-01-05.
- ↑ Bureau of Meteorology. Climate of Giles. Retrieved on 2008-05-03.
- 1 2 J. Horel. Normal Monthly Precipitation, Inches. Retrieved on 2008-03-19.
- ↑ NationalAtlas.gov Precipitation of the Individual States and of the Conterminous States. Retrieved on 2008-03-09.
- ↑ Kristen L. Corbosiero; Michael J. Dickinson & Lance F. Bosart (2009). "The Contribution of Eastern North Pacific Tropical Cyclones to the Rainfall Climatology of the Southwest United States". Monthly Weather Review. American Meteorological Society. 137 (8): 2415–2435. Bibcode:2009MWRv..137.2415C. doi:10.1175/2009MWR2768.1. ISSN 0027-0644.
- ↑ Central Intelligence Agency. The World Factbook – Virgin Islands. Retrieved on 2008-03-19.
- ↑ BBC. Weather Centre - World Weather - Country Guides - Northern Mariana Islands. Retrieved on 2008-03-19.
- ↑ Walker S. Ashley, Thomas L. Mote, P. Grady Dixon, Sharon L. Trotter, Emily J. Powell, Joshua D. Durkee, and Andrew J. Grundstein. Distribution of Mesoscale Convective Complex Rainfall in the United States. Retrieved on 2008-03-02.
- ↑ John Monteverdi and Jan Null. Western Region Technical Attachment NO. 97-37 November 21, 1997: El Niño and California Precipitation. Retrieved on 2008-02-28.
- ↑ Southeast Climate Consortium (2007-12-20). "SECC Winter Climate Outlook". Archived from the original on 2008-03-04. Retrieved 2008-02-29.
- ↑ Reuters (2007-02-16). "La Nina could mean dry summer in Midwest and Plains". Retrieved 2008-02-29.
- ↑ Climate Prediction Center. El Niño (ENSO) Related Rainfall Patterns Over the Tropical Pacific. Retrieved on 2008-02-28.
- ↑ A. J. Philip (2004-10-12). "Mawsynram in India" (PDF). Tribune News Service. Retrieved 2010-01-05.
- ↑ Bureau of Meteorology (2010). "Significant Weather - December 2000 (Rainfall)". Commonwealth of Australia. Retrieved 2010-01-15.
- 1 2 3 National Climatic Data Center (2005-08-09). "Global Measured Extremes of Temperature and Precipitation". National Oceanic and Atmospheric Administration. Retrieved 2007-01-18.
- ↑ "USGS 220427159300201 1047.0 Mt. Waialeale rain gauge nr Lihue, Kauai, HI". USGS Real-time rainfall data at Waiʻaleʻale Raingauge. Retrieved 2008-12-11.
- ↑ Alfred Rodríguez Picódate (2008-02-07). "Tutunendaó, Choco: la ciudad colombiana es muy lluviosa". El Periódico.com. Retrieved 2008-12-11.
- ↑ "Global Measured Extremes of Temperature and Precipitation#Highest Average Annual Precipitation Extremes". National Climatic Data Center. August 9, 2004.
- 1 2 3 4 5 "Global Weather & Climate Extremes". World Meteorological Organization. Retrieved 2013-04-18.
- ↑ "World Rainfall Extremes". Members.iinet.net.au. 2004-03-02. Retrieved 2011-12-26.
- ↑ Emily Lakdawalla (2004-01-21). "Titan: Arizona in an Icebox?". The Planetary Society. Archived from the original on 2005-01-24. Retrieved 2005-03-28.
- ↑ Paul Rincon (2005-11-07). "Planet Venus: Earth's 'evil twin'". BBC News. Retrieved 2010-01-25.
- ↑ Paul Mahaffy. "Highlights of the Galileo Probe Mass Spectrometer Investigation". NASA Goddard Space Flight Center, Atmospheric Experiments Laboratory. Retrieved 2007-06-06.
- ↑ Katharina Lodders (2004). "Jupiter Formed with More Tar than Ice". The Astrophysical Journal. 611 (1): 587–597. Bibcode:2004ApJ...611..587L. doi:10.1086/421970.
- ↑ Harvard University and Smithsonian Institution (2003-01-08). "New World of Iron Rain". Astrobiology Magazine. Retrieved 2010-01-25.
- ↑ UFL - Dispute between Mawsynram and Cherrapunji for the rainiest place in the world
External links
| Wikiquote has quotations related to: Rain |
| Wikimedia Commons has media related to Rain. |
- What are clouds, and why does it rain?
- BBC article on the weekend rain effect
- BBC article on rain-making
- BBC article on the mathematics of running in the rain
| Air |
|  | ||||||
|---|---|---|---|---|---|---|---|---|
| Energy | ||||||||
| Land | ||||||||
| Life | ||||||||
| Water |
| |||||||
| Related |
| |||||||
| ||||||||
| ||||||||