Missouri's 8th congressional district
| Missouri's 8th congressional district | |
|---|---|
|
Missouri's 8th congressional district - since January 3, 2013. | |
| Current Representative | Jason T. Smith (R) |
| Distribution |
|
| Population (2010) | 749,444 |
| Median income | 35,965 |
| Ethnicity |
|
| Occupation | |
| Cook PVI | R+17 |
.tif.png)
Missouri's 8th Congressional District is one of 435 congressional districts in the United States and one of eight congressional districts in the state of Missouri. The district encompasses rural Southeast Missouri and South Central Missouri as well as some counties in Southwest Missouri. The district stretches from the Bootheel in the south to the St. Louis southern exurbs of Festus, Hillsboro, and surrounding areas in the Lead Belt; it ranges in the east to counties along the Mississippi River and in the west to counties along the Ozark Plateau near Branson.
The district's largest city is Cape Girardeau. A predominantly rural district, the district votes strongly Republican for national offices. In 2004, President George W. Bush received 63% of the vote in the district over U.S. Senator John Kerry (D-Massachusetts) who clinched 36%. In 2008, U.S. Senator John McCain (R-Arizona) carried the district with 61.92% over U.S. Senator Barack Obama (D-Illinois), who received 36.42%. The district increased the margin for Republicans in 2012 when former Governor Mitt Romney (R-Massachusetts) gained 65.88% of the vote over President Barack Obama's 31.99%.
Jason T. Smith, a Republican, has represented the district in the US Congress since winning a special election on June 4, 2013. The incumbent Republican U.S. Representative Jo Ann Emerson resigned on January 22, 2013 to take a position as CEO for the National Rural Electric Cooperative Association.
History
Redistricting (2012)
Missouri lost one of its nine congressional district seats following redistricting based on population numbers from the 2010 U.S. Census. The Republican-controlled state legislature decided to redefine Missouri's 3rd Congressional District, which was represented by U.S. Representative Russ Carnahan (D-St. Louis). The district included all of Ste. Genevieve and Jefferson counties and southern St. Louis County and the neighborhoods making up what is known as South City of St. Louis. Missouri’s 8th Congressional District lost its Taney County parts (which were redistricted to the Southwestern-based 7th Congressional District, and picked up all of Crawford and Ste. Genevieve counties, and most of the southern and western rural parts of Jefferson County. Parts of Jefferson County that are now included in Missouri’s 8th include all of the cities of Hillsboro and De Soto, and the extreme southern portions of the Twin Cities of Festus and Crystal City (most of these two cities are now part of the 2nd Congressional District).
Character
Missouri's 8th is a relatively diverse congressional district. Although it is quite conservative and Republican-leaning at the federal level, Democrats often perform well here in local and state elections. Bill Clinton, a Democrat from neighboring Arkansas, carried the previous 8th District both times in 1992 and 1996; since then, however, voters in the district have solidly supported the past three Republican presidential nominees.
At the local level, Democrats control a slight majority of elected county offices in Southeast Missouri. In presidential elections, Democratic candidates often perform best in the Bootheel, an agricultural area that is the most impoverished region in the district (and the state, for that matter). It has a wide majority of whites and a significant minority of African Americans. Democrats also do well in the Lead Belt region, which contains a core constituency of voters who belong to labor unions, particularly in the mining industry.
The district takes in a large swath of the Bible Belt with evangelical Protestantism being the dominant religion in most counties in the district. This influence is demonstrated in conservative voters' positions on social issues such as abortion, gay rights and gun control. In the more rural regions, hunting is common and a rite of passage for many people in the district. Racially, this district is predominately white. Many voters here maintain a rural lifestyle where agriculture and farming are the backbone of the economy and are important issues of concerns. Socioeconomically, it is the poorest district in Missouri (when measured by the median household income adjusted by inflation).
List of representatives
| Representative | Party | Years | Electoral history | |
|---|---|---|---|---|
| District created March 4, 1863 | ||||
 William A. Hall William A. Hall |
Unionist | March 4, 1863 – March 3, 1865 |
Redistricted from the 3rd district | |
 John F. Benjamin John F. Benjamin |
Republican | March 4, 1865 – March 3, 1871 |
[Data unknown/missing. You can help!] | |
 James G. Blair James G. Blair |
Liberal Republican | March 4, 1871 – March 3, 1873 |
[Data unknown/missing. You can help!] | |
 Abram Comingo Abram Comingo |
Democratic | March 4, 1873 – March 3, 1875 |
Redistricted from the 6th district | |
 Benjamin J. Franklin Benjamin J. Franklin |
Democratic | March 4, 1875 – March 3, 1879 |
[Data unknown/missing. You can help!] | |
 Samuel L. Sawyer Samuel L. Sawyer |
Independent Democrat | March 4, 1879 – March 3, 1881 |
[Data unknown/missing. You can help!] | |
 Robert T. Van Horn Robert T. Van Horn |
Republican | March 4, 1881 – March 3, 1883 |
[Data unknown/missing. You can help!] | |
 John J. O'Neill John J. O'Neill |
Democratic | March 4, 1883 – March 3, 1889 |
[Data unknown/missing. You can help!] | |
 Frederick G. Niedringhaus Frederick G. Niedringhaus |
Republican | March 4, 1889 – March 3, 1891 |
[Data unknown/missing. You can help!] | |
| John J. O'Neill |
Democratic | March 4, 1891 – March 3, 1893 |
[Data unknown/missing. You can help!] | |
 Richard P. Bland Richard P. Bland |
Democratic | March 4, 1893 – March 3, 1895 |
Redistricted from the 11th district | |
 Joel D. Hubbard Joel D. Hubbard |
Republican | March 4, 1895 – March 3, 1897 |
[Data unknown/missing. You can help!] | |
| Richard P. Bland |
Democratic | March 4, 1897 – June 15, 1899 |
Died | |
| Vacant | June 15, 1899 – August 29, 1899 | |||
 Dorsey W. Shackleford Dorsey W. Shackleford |
Democratic | August 29, 1899 – March 3, 1919 |
[Data unknown/missing. You can help!] | |
 William L. Nelson William L. Nelson |
Democratic | March 4, 1919 – March 3, 1921 |
[Data unknown/missing. You can help!] | |
 Sidney C. Roach Sidney C. Roach |
Republican | March 4, 1921 – March 3, 1925 |
[Data unknown/missing. You can help!] | |
| William L. Nelson |
Democratic | March 4, 1925 – March 3, 1933 |
[Data unknown/missing. You can help!] | |
| District inactive, all representatives elected At-large on a general ticket | March 4, 1933 – January 3, 1935 | |||
| Clyde Williams |
Democratic | January 3, 1935 – January 3, 1943 |
Redistricted from the At-large district | |
| William P. Elmer |
Republican | January 3, 1943 – January 3, 1945 |
[Data unknown/missing. You can help!] | |
 A. S. J. Carnahan A. S. J. Carnahan |
Democratic | January 3, 1945 – January 3, 1947 |
[Data unknown/missing. You can help!] | |
.jpg) Parke M. Banta Parke M. Banta |
Republican | January 3, 1947 – January 3, 1949 |
[Data unknown/missing. You can help!] | |
| A. S. J. Carnahan |
Democratic | January 3, 1949 – January 3, 1961 |
[Data unknown/missing. You can help!] | |
 Richard H. Ichord II Richard H. Ichord II |
Democratic | January 3, 1961 – January 3, 1981 |
[Data unknown/missing. You can help!] | |
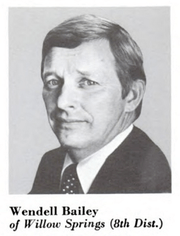 Wendell Bailey Wendell Bailey |
Republican | January 3, 1981 – January 3, 1983 |
[Data unknown/missing. You can help!] | |
 Bill Emerson Bill Emerson |
Republican | January 3, 1983 – June 22, 1996 |
Redistricted from the 10th district Died | |
| Vacant | June 22, 1996 – November 5, 1996 | |||
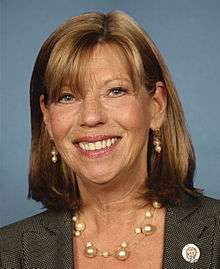 Jo Ann Emerson Jo Ann Emerson | ||||
| Republican | November 5, 1996 – January 3, 1997 |
First elected to finish her husband's term | ||
| Independent | January 3, 1997 – January 8, 1997 |
Elected as an Independent caucusing with Republicans due to Missouri state law. | ||
| Republican | January 8, 1997 – January 22, 2013 |
Changed parties Resigned | ||
| Vacant | January 22, 2013 – June 4, 2013 | |||
 Jason T. Smith Jason T. Smith |
Republican | June 4, 2013 – Present |
First elected to finish Jo Ann Emerson's term | |
Counties
There are 30 counties included in the district.
Presidential Election Results
2000
| County | George W. Bush | % | Al Gore | % | Ralph Nader | % | Others | % | Margin | % | Total |
|---|---|---|---|---|---|---|---|---|---|---|---|
| Bollinger | 3,487 | 65.87% | 1,692 | 31.96% | 41 | 0.77% | 74 | 1.40% | −1,795 | R+ 33.91% | 5,294 |
| Butler | 9,111 | 63.28% | 4,996 | 34.70% | 149 | 1.03% | 141 | 0.99% | −4,115 | R+ 28.58% | 14,397 |
| Cape Girardeau | 19,832 | 66.42% | 9,334 | 31.26% | 376 | 1.26% | 317 | 1.06% | −10,498 | R+ 35.16% | 29,859 |
| Carter | 1,730 | 61.61% | 997 | 35.51% | 40 | 1.42% | 41 | 1.46% | −733 | R+ 26.10% | 2,808 |
| Crawford | 4,754 | 57.26% | 3,350 | 40.35% | 100 | 1.20% | 98 | 1.19% | −1,404 | R+ 16.91% | 8,302 |
| Dent | 3,996 | 66.73% | 1,839 | 30.71% | 66 | 1.10% | 87 | 1.46% | −2,157 | R+ 36.02% | 5,988 |
| Dunklin | 5,426 | 51.55% | 4,947 | 47.00% | 78 | 0.74% | 74 | 0.70% | −479 | R+ 4.55% | 10,525 |
| Howell | 9,018 | 64.07% | 4,641 | 32.97% | 197 | 1.40% | 219 | 1.56% | −4,377 | R+ 31.10% | 14,075 |
| Iron | 2,237 | 50.68% | 2,044 | 46.31% | 64 | 1.45% | 69 | 1.56% | −193 | R+ 4.37% | 4,414 |
| Madison | 2,460 | 56.25% | 1,828 | 41.80% | 42 | 0.96% | 43 | 0.99% | −632 | R+ 14.45% | 4,373 |
| Mississippi | 2,395 | 45.93% | 2,756 | 52.85% | 29 | 0.56% | 35 | 0.67% | −361 | D+ 6.92% | 5,215 |
| New Madrid | 3,416 | 47.01% | 3,738 | 51.45% | 45 | 0.62% | 67 | 0.92% | −322 | D+ 4.44% | 7,266 |
| Oregon | 2,521 | 59.56% | 1,568 | 37.04% | 60 | 1.42% | 84 | 1.98% | −953 | R+ 22.52% | 4,233 |
| Pemiscot | 2,750 | 45.38% | 3,245 | 53.55% | 37 | 0.61% | 28 | 0.46% | −495 | D+ 8.17% | 6,060 |
| Perry | 4,667 | 67.61% | 2,085 | 30.20% | 70 | 1.01% | 81 | 1.17% | −2,582 | R+ 37.41% | 6,903 |
| Phelps | 9,444 | 58.49% | 6,262 | 38.78% | 253 | 1.57% | 187 | 1.16% | −3,182 | R+ 19.71% | 16,146 |
| Reynolds | 1,762 | 56.28% | 1,298 | 41.46% | 42 | 1.34% | 29 | 0.92% | −464 | R+ 14.82% | 3,131 |
| Ripley | 3,121 | 61.62% | 1,820 | 35.93% | 58 | 1.15% | 66 | 1.30% | −1,301 | R+ 25.69% | 5,065 |
| Scott | 8,999 | 57.30% | 6,452 | 41.09% | 113 | 0.72% | 130 | 0.83% | −2,547 | R+ 16.21% | 15,704 |
| Shannon | 2,245 | 59.38% | 1,430 | 37.82% | 48 | 1.27% | 58 | 1.53% | −815 | R+ 21.56% | 3,781 |
| St. Francois | 9,327 | 49.50% | 9,075 | 48.17% | 265 | 1.41% | 174 | 0.93% | −252 | R+ 1.33% | 18,841 |
| Stoddard | 7,727 | 62.04% | 4,476 | 35.94% | 114 | 0.92% | 137 | 1.10% | −3,251 | R+ 26.10% | 12,454 |
| Texas | 6,136 | 61.78% | 3,486 | 35.10% | 137 | 1.38% | 173 | 1.74% | −2,650 | R+ 26.68% | 9,932 |
| Washington | 4,020 | 48.64% | 4,047 | 48.97% | 95 | 1.15% | 103 | 1.25% | −27 | D+ 0.33% | 8,265 |
| Wayne | 3,346 | 57.22% | 2,387 | 40.82% | 55 | 0.94% | 60 | 1.03% | −959 | R+ 16.40% | 5,848 |
| Wright | 5,391 | 68.75% | 2,250 | 28.70% | 86 | 1.10% | 114 | 1.45% | −3,141 | R+ 40.05% | 7,841 |
| District Total | 139,318 | 58.85% | 92,043 | 38.88% | 2,660 | 1.12% | 2,689 | 1.14% | 47,275 | R+ 19.97% | 236,720 |
2004
| County | George W. Bush | % | John Kerry | % | Others | % | Margin | % | Total |
|---|---|---|---|---|---|---|---|---|---|
| Bollinger | 4,102 | 69.58% | 1,754 | 29.75% | 39 | 0.63% | −2,348 | R+ 39.83% | 5,895 |
| Butler | 11,696 | 71.14% | 4,666 | 28.38% | 79 | 0.48% | −7,030 | R+ 42.76% | 16,441 |
| Cape Girardeau | 23,814 | 68.90% | 10,568 | 30.57% | 183 | 0.53% | −13,246 | R+ 38.33% | 34,565 |
| Carter | 1,797 | 64.66% | 964 | 34.69% | 18 | 0.64% | −833 | R+ 29.97% | 2,779 |
| Dent | 4,369 | 69.31% | 1,865 | 29.58% | 70 | 1.12% | −2,504 | R+ 39.73% | 6,304 |
| Douglas | 4,498 | 71.09% | 1,741 | 27.52% | 88 | 1.39% | −2,757 | R+ 43.57% | 6,327 |
| Dunklin | 6,720 | 57.55% | 4,901 | 41.97% | 56 | 0.48% | −1,819 | R+ 15.58% | 11,677 |
| Howell | 11,097 | 67.75% | 5,118 | 31.25% | 164 | 1.00% | −5,979 | R+ 36.50% | 16,379 |
| Iron | 2,477 | 52.94% | 2,157 | 46.10% | 45 | 0.96% | −320 | R+ 6.84% | 4,679 |
| Madison | 2,905 | 59.07% | 1,972 | 40.10% | 41 | 0.84% | −933 | R+ 18.97% | 4,918 |
| Mississippi | 2,903 | 54.79% | 2,374 | 44.81% | 21 | 0.40% | −529 | R+ 9.98% | 5,298 |
| New Madrid | 4,154 | 52.54% | 3,716 | 47.00% | 37 | 0.47% | −438 | R+ 5.54% | 7,907 |
| Oregon | 2,769 | 59.26% | 1,823 | 39.01% | 81 | 1.74% | −946 | R+ 20.25% | 4,673 |
| Ozark | 3,083 | 65.50% | 1,561 | 33.16% | 63 | 1.34% | −1,522 | R+ 32.34% | 4,707 |
| Pemiscot | 3,398 | 49.93% | 3,381 | 49.68% | 27 | 0.40% | −17 | R+ 0.25% | 6,806 |
| Perry | 5,583 | 67.70% | 2,621 | 31.78% | 43 | 0.52% | −2,962 | R+ 35.92% | 8,247 |
| Phelps | 11,874 | 63.50% | 6,666 | 35.65% | 160 | 0.75% | −5,208 | R+ 27.85% | 18,700 |
| Reynolds | 1,896 | 56.36% | 1,449 | 43.07% | 19 | 0.57% | −447 | R+ 13.29% | 3,364 |
| Ripley | 3,693 | 65.33% | 1,907 | 33.73% | 53 | 0.94% | −1,786 | R+ 31.60% | 5,653 |
| Scott | 11,330 | 64.94% | 6,057 | 34.71% | 61 | 0.35% | −5,273 | R+ 30.23% | 17,448 |
| Shannon | 2,511 | 60.26% | 1,618 | 38.83% | 38 | 0.92% | −893 | R+ 21.43% | 4,167 |
| St. Francois | 12,087 | 52.71% | 10,748 | 46.87% | 98 | 0.43% | −1,339 | R+ 5.84% | 22,933 |
| Stoddard | 9,242 | 69.74% | 3,946 | 29.78% | 64 | 0.48% | −5,296 | R+ 39.96% | 13,252 |
| Taney* | 3,496 | 67.53% | 1,644 | 31.76% | 37 | 0.71% | −1,852 | R+ 35.77% | 5,177 |
| Texas | 7,234 | 65.66% | 3,664 | 33.25% | 120 | 1.09% | −3,570 | R+ 32.41% | 11,018 |
| Washington | 4,641 | 50.57% | 4,459 | 48.58% | 78 | 0.84% | −182 | R+ 1.99% | 9,178 |
| Wayne | 3,919 | 63.17% | 2,250 | 36.27% | 35 | 0.57% | −1,669 | R+ 26.90% | 6,204 |
| Wright | 6,090 | 72.97% | 2,188 | 26.22% | 68 | 0.82% | −3,902 | R+ 46.75% | 8,346 |
| District Total | 173,378 | 63.50% | 97,778 | 35.81% | 1,886 | 0.69% | 75,600 | R+ 27.69% | 273,042 |
- These numbers reflect only the eastern sections of Taney County that were included in the 8th Congressional District.
2008
| County | John McCain | % | Barack Obama | % | Others | % | Margin | % | Total |
|---|---|---|---|---|---|---|---|---|---|
| Bollinger | 3,972 | 68.67% | 1,690 | 29.22% | 122 | 2.11% | −2,282 | R+ 39.45% | 5,784 |
| Butler | 11,805 | 68.09% | 5,316 | 30.66% | 217 | 1.25% | −6,489 | R+ 37.43% | 17,338 |
| Cape Girardeau | 24,768 | 66.30% | 12,208 | 32.68% | 379 | 1.01% | −12,560 | R+ 33.62% | 37,446 |
| Carter | 1,840 | 63.49% | 984 | 33.95% | 74 | 2.55% | −856 | R+ 29.54% | 2,898 |
| Dent | 4,655 | 67.78% | 2,056 | 29.94% | 157 | 2.29% | −2,599 | R+ 37.84% | 6,868 |
| Douglas | 4,405 | 65.63% | 2,140 | 31.88% | 167 | 2.49% | −2,265 | R+ 33.75% | 6,712 |
| Dunklin | 7,044 | 59.88% | 4,540 | 38.59% | 180 | 1.53% | −2,504 | R+ 21.29% | 11,764 |
| Howell | 10,982 | 64.49% | 5,736 | 33.68% | 311 | 1.83% | −5,246 | R+ 30.81% | 17,029 |
| Iron | 2,090 | 47.35% | 2,213 | 50.14% | 111 | 2.51% | −123 | D+ 2.79% | 4,414 |
| Madison | 2,897 | 57.62% | 2,042 | 40.61% | 89 | 1.77% | −855 | R+ 17.01% | 5,028 |
| Mississippi | 3,034 | 56.65% | 2,247 | 41.95% | 75 | 1.40% | −787 | R+ 14.70% | 5,356 |
| New Madrid | 4,593 | 56.76% | 3,370 | 41.65% | 129 | 1.59% | −1,223 | R+ 15.11% | 8,092 |
| Oregon | 2,652 | 57.77% | 1,811 | 39.45% | 128 | 2.78% | −841 | R+ 18.32% | 4,591 |
| Ozark | 2,918 | 62.27% | 1,661 | 35.45% | 107 | 2.28% | −1,257 | R+ 26.82% | 4,686 |
| Pemiscot | 3,954 | 56.11% | 3,029 | 42.98% | 64 | 0.91% | −925 | R+ 13.13% | 7,047 |
| Perry | 5,527 | 63.92% | 3,005 | 34.75% | 115 | 1.33% | −2,522 | R+ 29.17% | 8,647 |
| Phelps | 11,706 | 60.22% | 7,394 | 38.04% | 338 | 1.74% | −4,312 | R+ 22.18% | 19,524 |
| Reynolds | 1,782 | 54.21% | 1,418 | 43.14% | 87 | 2.65% | −364 | R+ 11.07% | 3,287 |
| Ripley | 3,407 | 63.53% | 1,795 | 33.47% | 161 | 3.00% | −1,612 | R+ 30.06% | 5,363 |
| Scott | 11,563 | 64.15% | 6,258 | 34.72% | 205 | 1.13% | −5,305 | R+ 29.43% | 18,082 |
| Shannon | 2,075 | 54.06% | 1,637 | 42.65% | 126 | 3.29% | −438 | R+ 11.41% | 3,838 |
| St. Francois | 12,660 | 51.57% | 11,540 | 47.01% | 350 | 1.42% | −1,120 | R+ 4.56% | 24,550 |
| Stoddard | 9,172 | 69.16% | 3,899 | 29.40% | 191 | 1.44% | −5,273 | R+ 39.76% | 13,262 |
| Taney* | 2,138 | 67.62% | 979 | 30.96% | 45 | 1.42% | −1,159 | R+ 36.66% | 3,162 |
| Texas | 7,215 | 66.49% | 3,410 | 31.43% | 226 | 2.08% | −3,805 | R+ 35.06% | 10,851 |
| Washington | 4,706 | 48.95% | 4,711 | 49.00% | 197 | 2.05% | −5 | D+ 0.05% | 9,614 |
| Wayne | 3,784 | 61.49% | 2,243 | 36.45% | 127 | 2.06% | −1,541 | R+ 25.04% | 6,154 |
| Wright | 5,784 | 67.94% | 2,557 | 30.03% | 173 | 2.03% | −3,227 | R+ 37.91% | 8,514 |
| District Total | 174,564 | 61.92% | 102,682 | 36.42% | 4,688 | 1.66% | 71,882 | R+ 25.50% | 281,934 |
- These numbers reflect only the eastern sections of Taney County that were included in the 8th Congressional District.
2012
| County | Mitt Romney | % | Barack Obama | % | Others | % | Margin | % | Total |
|---|---|---|---|---|---|---|---|---|---|
| Bollinger | 4,095 | 75.05% | 1,213 | 22.23% | 148 | 2.72% | −2,882 | R+ 52.82% | 5,456 |
| Butler | 12,248 | 72.52% | 4,363 | 25.83% | 278 | 1.65% | −7,885 | R+ 46.69% | 16,889 |
| Cape Girardeau | 25,370 | 70.81% | 9,728 | 27.15% | 731 | 2.04% | −15,642 | R+ 43.66% | 35,829 |
| Carter | 1,978 | 70.67% | 754 | 26.94% | 67 | 2.39% | −1,224 | R+ 43.73% | 2,799 |
| Crawford | 6,434 | 67.17% | 2,951 | 30.81% | 194 | 2.03% | −3,483 | R+ 36.36% | 9,579 |
| Dent | 4,883 | 73.51% | 1,585 | 23.86% | 175 | 2.63% | −3,298 | R+ 49.65% | 6,671 |
| Douglas | 4,649 | 70.90% | 1,710 | 26.08% | 198 | 3.02% | −2,939 | R+ 44.82% | 6,557 |
| Dunklin | 6,850 | 64.31% | 3,636 | 34.14% | 165 | 1.55% | −3,214 | R+ 30.17% | 10,651 |
| Howell | 11,544 | 70.62% | 4,395 | 26.89% | 407 | 2.49% | −7,149 | R+ 43.73% | 16,346 |
| Iron | 2,252 | 55.87% | 1,669 | 41.40% | 110 | 2.73% | −583 | R+ 14.47% | 4,031 |
| Jefferson* | 14,608 | 55.18% | 11,277 | 42.59% | 591 | 2.23% | −3,331 | R+ 12.59% | 26,476 |
| Madison | 3,227 | 65.46% | 1,588 | 32.21% | 115 | 2.33% | −1,639 | R+ 33.25% | 4,930 |
| Mississippi | 2,997 | 60.91% | 1,858 | 37.76% | 65 | 1.33% | −1,139 | R+ 23.15% | 4,920 |
| New Madrid | 4,284 | 59.09% | 2,814 | 38.81% | 152 | 2.10% | −1,470 | R+ 20.28% | 7,250 |
| Oregon | 2,886 | 65.28% | 1,419 | 32.10% | 116 | 2.62% | −1,467 | R+ 33.18% | 4,421 |
| Ozark | 3,080 | 69.17% | 1,261 | 28.32% | 112 | 2.51% | −1,819 | R+ 40.85% | 4,453 |
| Pemiscot | 3,598 | 56.80% | 2,671 | 42.16% | 66 | 1.04% | −927 | R+ 14.64% | 6,335 |
| Perry | 5,669 | 70.98% | 2,184 | 27.34% | 134 | 1.68% | −3,485 | R+ 43.64% | 7,987 |
| Phelps | 11,895 | 65.05% | 5,798 | 31.71% | 593 | 3.24% | −6,097 | R+ 33.34% | 18,286 |
| Reynolds | 1,931 | 60.31% | 1,157 | 36.13% | 114 | 3.56% | −774 | R+ 24.18% | 3,202 |
| Ripley | 3,743 | 71.12% | 1,396 | 26.52% | 124 | 2.36% | −2,347 | R+ 44.60% | 5,263 |
| Scott | 11,623 | 68.37% | 5,122 | 30.13% | 254 | 1.50% | −6,501 | R+ 38.24% | 16,999 |
| Shannon | 2,262 | 61.27% | 1,302 | 35.27% | 128 | 3.46% | −960 | R+ 26.00% | 3,692 |
| St. Francois | 13,248 | 58.67% | 8,829 | 39.10% | 505 | 2.23% | −4,419 | R+ 19.57% | 22,705 |
| Ste. Genevieve | 4,055 | 50.25% | 3,813 | 47.25% | 202 | 2.50% | −242 | R+ 3.00% | 8,070 |
| Stoddard | 9,496 | 73.81% | 3,153 | 24.51% | 217 | 1.68% | −6,343 | R+ 49.30% | 12,866 |
| Texas | 7,618 | 70.77% | 2,871 | 26.67% | 275 | 2.56% | −4,747 | R+ 44.10% | 10,764 |
| Washington | 5,071 | 58.32% | 3,417 | 39.30% | 207 | 2.38% | −1,654 | R+ 19.02% | 8,695 |
| Wayne | 3,790 | 66.26% | 1,813 | 31.70% | 117 | 2.04% | −1,977 | R+ 34.56% | 5,720 |
| Wright | 5,830 | 73.29% | 1,953 | 24.55% | 172 | 2.16% | −3,877 | R+ 48.74% | 7,955 |
| District Total | 201,214 | 65.88% | 97,700 | 31.99% | 6,523 | 2.13% | 103,514 | R+ 33.89% | 305,437 |
- These numbers reflect only the western and southern sections of Jefferson County that are included in the 8th Congressional District.
Presidential Primary Election Results
2008 Democratic Presidential Primary
| County | Hillary Clinton | % | Barack Obama | % | John Edwards | % | Others | % | Margin | % | Total |
|---|---|---|---|---|---|---|---|---|---|---|---|
| Bollinger | 971 | 74.12% | 293 | 22.37% | 38 | 2.90% | 8 | 0.61% | −678 | C+ 51.75% | 1,310 |
| Butler | 2,490 | 69.87% | 960 | 26.94% | 82 | 2.30% | 32 | 0.90% | −1,530 | C+ 42.93% | 3,564 |
| Cape Girardeau | 4,510 | 56.55% | 3,145 | 39.44% | 247 | 3.10% | 73 | 0.92% | −1,365 | C+ 17.11% | 7,975 |
| Carter | 541 | 75.24% | 137 | 19.05% | 32 | 4.45% | 5 | 0.70% | −404 | C+ 56.19% | 719 |
| Dent | 962 | 62.23% | 493 | 31.89% | 74 | 4.79% | 17 | 1.10% | −469 | C+ 30.34% | 1,546 |
| Douglas | 827 | 62.32% | 454 | 34.21% | 39 | 2.94% | 7 | 0.53% | −373 | C+ 28.11% | 1,327 |
| Dunklin | 2,587 | 78.44% | 604 | 18.31% | 69 | 2.09% | 38 | 1.15% | −1,983 | C+ 60.13% | 3,298 |
| Howell | 2,307 | 64.07% | 1,168 | 32.44% | 99 | 2.75% | 27 | 0.75% | −1,139 | C+ 31.63% | 3,601 |
| Iron | 1,180 | 70.53% | 406 | 24.27% | 72 | 4.30% | 15 | 0.90% | −774 | C+ 46.26% | 1,673 |
| Madison | 971 | 68.72% | 344 | 24.35% | 64 | 4.53% | 34 | 2.40% | −627 | C+ 44.37% | 1,413 |
| Mississippi | 1,094 | 65.43% | 502 | 30.02% | 57 | 3.41% | 19 | 1.14% | −592 | C+ 35.41% | 1,672 |
| New Madrid | 1,801 | 71.19% | 610 | 24.11% | 101 | 3.99% | 18 | 0.71% | −1,191 | C+ 47.08% | 2,530 |
| Oregon | 989 | 71.77% | 332 | 24.09% | 42 | 3.05% | 15 | 1.09% | −657 | C+ 47.68% | 1,378 |
| Ozark | 689 | 65.62% | 332 | 31.62% | 18 | 1.71% | 11 | 1.05% | −357 | C+ 34.00% | 1,050 |
| Pemiscot | 1,270 | 70.83% | 466 | 25.99% | 34 | 1.90% | 23 | 1.28% | −804 | C+ 44.84% | 1,793 |
| Perry | 1,180 | 61.24% | 650 | 33.73% | 81 | 4.20% | 16 | 0.83% | −530 | C+ 27.51% | 1,927 |
| Phelps | 2,392 | 53.93% | 1,878 | 42.34% | 122 | 2.75% | 43 | 0.97% | −514 | C+ 11.59% | 4,435 |
| Reynolds | 741 | 66.22% | 277 | 24.75% | 70 | 6.26% | 31 | 2.77% | −464 | C+ 41.47% | 1,119 |
| Ripley | 1,073 | 74.20% | 282 | 19.50% | 72 | 4.98% | 19 | 1.31% | −791 | C+ 54.70% | 1,446 |
| Scott | 2,931 | 63.43% | 1,443 | 31.23% | 191 | 4.13% | 56 | 1.22% | −1,488 | C+ 32.20% | 4,621 |
| Shannon | 914 | 69.72% | 323 | 24.64% | 50 | 3.81% | 24 | 1.83% | −591 | C+ 45.08% | 1,311 |
| St. Francois | 5,418 | 70.25% | 1,993 | 25.84% | 224 | 2.90% | 78 | 1.01% | −3,425 | C+ 44.41% | 7,713 |
| Stoddard | 2,225 | 72.95% | 684 | 22.43% | 112 | 3.67% | 29 | 0.95% | −1,541 | C+ 50.52% | 3,050 |
| Taney* | 1,219 | 62.51% | 674 | 34.56% | 39 | 2.00% | 18 | 0.92% | −545 | C+ 27.95% | 1,950 |
| Texas | 1,858 | 68.03% | 743 | 27.21% | 101 | 3.70% | 29 | 1.06% | −1,115 | C+ 40.82% | 2,731 |
| Washington | 2,345 | 74.63% | 670 | 21.32% | 100 | 3.18% | 27 | 0.86% | −1,675 | C+ 53.31% | 3,142 |
| Wayne | 1,458 | 75.94% | 359 | 18.70% | 71 | 3.70% | 32 | 1.66% | −1,099 | C+ 57.24% | 1,920 |
| Wright | 1,143 | 69.48% | 452 | 27.48% | 36 | 2.19% | 14 | 0.85% | −691 | C+ 42.00% | 1,645 |
| District Total | 48,086 | 66.92% | 20,674 | 28.77% | 2,337 | 3.25% | 762 | 1.06% | 27,412 | C+ 38.15% | 71,859 |
- These numbers reflect only the eastern sections of Taney County that were included in the 8th Congressional District at the time of the Missouri Democratic Presidential Primary on Super Tuesday, February 5, 2008.
2008 Republican Presidential Primary
| County | Mike Huckabee | % | John McCain | % | Mitt Romney | % | Ron Paul | % | Others | % | Margin | % | Total |
|---|---|---|---|---|---|---|---|---|---|---|---|---|---|
| Bollinger | 657 | 39.72% | 518 | 31.32% | 384 | 23.22% | 65 | 3.93% | 30 | 1.81% | −139 | H+ 8.04% | 1,654 |
| Butler | 2,215 | 48.85% | 1,117 | 24.64% | 1,007 | 22.21% | 134 | 2.96% | 61 | 1.35% | −1,098 | H+ 24.21% | 4,534 |
| Cape Girardeau | 3,068 | 27.63% | 3,528 | 31.77% | 3,922 | 35.32% | 361 | 3.25% | 226 | 2.04% | −394 | R+ 3.55% | 11,105 |
| Carter | 373 | 52.39% | 202 | 28.37% | 107 | 15.03% | 24 | 3.37% | 6 | 0.84% | −171 | H+ 24.02% | 712 |
| Dent | 959 | 48.78% | 442 | 22.48% | 411 | 20.91% | 127 | 6.46% | 27 | 1.37% | −517 | H+ 26.30% | 1,966 |
| Douglas | 1,343 | 55.04% | 516 | 21.15% | 270 | 11.07% | 295 | 12.09% | 16 | 0.66% | −827 | H+ 33.89% | 2,440 |
| Dunklin | 1,309 | 58.52% | 480 | 21.46% | 381 | 17.03% | 36 | 1.61% | 31 | 1.39% | −829 | H+ 37.06% | 2,237 |
| Howell | 2,882 | 52.97% | 1,347 | 24.76% | 793 | 14.57% | 356 | 6.54% | 63 | 1.16% | −1,535 | H+ 28.21% | 5,441 |
| Iron | 354 | 43.17% | 269 | 32.80% | 138 | 16.83% | 43 | 5.24% | 16 | 1.95% | −85 | H+ 10.37% | 820 |
| Madison | 560 | 43.96% | 452 | 35.48% | 185 | 14.52% | 51 | 4.00% | 26 | 2.04% | −108 | H+ 8.48% | 1,274 |
| Mississippi | 471 | 42.59% | 373 | 33.73% | 226 | 20.43% | 15 | 1.36% | 21 | 1.90% | −98 | H+ 8.86% | 1,106 |
| New Madrid | 656 | 48.74% | 386 | 28.68% | 250 | 18.57% | 43 | 3.19% | 11 | 0.82% | −270 | H+ 20.06% | 1,346 |
| Oregon | 696 | 58.88% | 242 | 20.47% | 134 | 11.34% | 101 | 8.54% | 9 | 0.76% | −454 | H+ 38.41% | 1,182 |
| Ozark | 766 | 48.09% | 428 | 26.87% | 235 | 14.75% | 149 | 9.35% | 15 | 0.94% | −338 | H+ 21.22% | 1,593 |
| Pemiscot | 565 | 57.59% | 233 | 23.75% | 149 | 15.19% | 20 | 2.04% | 14 | 1.43% | −332 | H+ 33.84% | 981 |
| Perry | 575 | 25.76% | 973 | 43.59% | 542 | 24.28% | 96 | 4.30% | 46 | 2.06% | −398 | M+ 17.83% | 2,232 |
| Phelps | 1,728 | 35.15% | 1,459 | 29.68% | 1,340 | 27.26% | 321 | 6.53% | 68 | 1.38% | −269 | H+ 5.47% | 4,916 |
| Reynolds | 283 | 46.09% | 202 | 32.90% | 93 | 15.15% | 25 | 4.07% | 11 | 1.79% | −81 | H+ 13.19% | 614 |
| Ripley | 750 | 53.84% | 329 | 23.62% | 238 | 17.09% | 52 | 3.73% | 24 | 1.72% | −421 | H+ 30.22% | 1,393 |
| Scott | 1,549 | 36.79% | 1,389 | 32.99% | 1,076 | 25.56% | 113 | 2.68% | 83 | 1.97% | −160 | H+ 3.80% | 4,210 |
| Shannon | 515 | 54.44% | 223 | 23.57% | 83 | 8.77% | 109 | 11.52% | 16 | 1.69% | −292 | H+ 30.87% | 946 |
| St. Francois | 1,631 | 35.90% | 1,727 | 38.01% | 949 | 20.89% | 134 | 2.95% | 102 | 2.25% | −96 | M+ 2.11% | 4,543 |
| Stoddard | 1,571 | 50.56% | 772 | 24.85% | 643 | 20.70% | 91 | 2.93% | 30 | 0.97% | −799 | H+ 25.71% | 3,107 |
| Taney* | 1,821 | 55.89% | 844 | 25.91% | 462 | 14.18% | 92 | 2.82% | 40 | 1.23% | −977 | H+ 29.98% | 3,258 |
| Texas | 1,727 | 50.13% | 954 | 27.69% | 480 | 13.93% | 234 | 6.79% | 50 | 1.45% | −773 | H+ 22.44% | 3,445 |
| Washington | 622 | 38.73% | 616 | 38.36% | 297 | 18.49% | 50 | 3.11% | 21 | 1.31% | −6 | H+ 0.37% | 1,606 |
| Wayne | 740 | 45.20% | 499 | 30.48% | 323 | 19.73% | 46 | 2.81% | 29 | 1.77% | −241 | H+ 14.72% | 1,637 |
| Wright | 1,878 | 59.64% | 746 | 23.69% | 298 | 9.46% | 178 | 5.65% | 49 | 1.56% | −1,132 | H+ 35.95% | 3,149 |
| District Total | 32,264 | 43.93% | 21,266 | 28.95% | 15,416 | 20.99% | 3,361 | 4.58% | 1,141 | 1.55% | 10,998 | H+ 14.98% | 73,447 |
- These numbers reflect only the eastern sections of Taney County that were included in the 8th Congressional District at the time of the Missouri Republican Presidential Primary on Super Tuesday, February 5, 2008.
Largest Cities
The 10 largest cities in the district are as follows.
| Rank | City | County | Population (2010) | Population (2015) |
|---|---|---|---|---|
| 1 | Cape Girardeau | Cape Girardeau and Scott | 37,941 | 39,462 |
| 2 | Rolla | Phelps | 19,559 | 20,019 |
| 3 | Poplar Bluff | Butler | 17,023 | 17,266 |
| 4 | Sikeston | Scott and New Madrid | 16,318 | 16,436 |
| 5 | Farmington | St. Francois | 16,240 | 18,181 |
| 6 | Jackson | Cape Girardeau | 13,758 | 14,869 |
| 7 | West Plains | Howell | 11,986 | 12,285 |
| 8 | Kennett | Dunklin | 10,932 | 10,662 |
| 9 | Park Hills | St. Francois | 8,759 | 8,692 |
| 10 | Perryville | Perry | 8,225 | 8,398 |
County Incomes
Median Household Incomes
| Rank | County | Income (2008) |
|---|---|---|
| 1 | Cape Girardeau | $45,862 |
| 2 | Perry | $44,264 |
| 3 | Taney | $39,771 |
| 4 | Scott | $39,735 |
| 5 | St. Francois | $39,551 |
| 6 | Phelps | $37,243 |
| 7 | Bollinger | $36,744 |
| 8 | Butler | $34,422 |
| 9 | Stoddard | $33,120 |
| 10 | Dent | $32,991 |
| 11 | New Madrid | $32,758 |
| 12 | Washington | $32,001 |
| 13 | Howell | $31,761 |
| 14 | Reynolds | $31,546 |
| 15 | Ozark | $31,508 |
| 16 | Douglas | $31,335 |
| 17 | Iron | $31,276 |
| 18 | Madison | $31,137 |
| 19 | Dunklin | $30,927 |
| 20 | Wright | $30,685 |
| 21 | Texas | $29,260 |
| 22 | Wayne | $29,166 |
| 23 | Mississippi | $28,837 |
| 24 | Carter | $27,608 |
| 25 | Ripley | $27,285 |
| 26 | Pemiscot | $26,992 |
| 27 | Oregon | $26,119 |
| 28 | Shannon | $24,835 |
Median Family Incomes
| Rank | County | Income (2008) |
|---|---|---|
| 1 | Cape Girardeau | $58,037 |
| 2 | Perry | $53,034 |
| 3 | Phelps | $49,343 |
| 4 | Scott | $48,847 |
| 5 | St. Francois | $47,923 |
| 6 | Taney | $47,664 |
| 7 | Bollinger | $42,948 |
| 8 | Butler | $42,713 |
| 9 | Stoddard | $41,072 |
| 10 | Dent | $40,258 |
| 11 | New Madrid | $39,411 |
| 12 | Dunklin | $38,439 |
| 13 | Washington | $38,193 |
| 14 | Madison | $38,067 |
| 15 | Howell | $38,047 |
| 16 | Iron | $38,037 |
| 17 | Reynolds | $37,891 |
| 18 | Wright | $37,139 |
| 19 | Douglas | $36,648 |
| 20 | Ozark | $36,622 |
| 21 | Mississippi | $35,554 |
| 22 | Wayne | $34,727 |
| 23 | Texas | $34,503 |
| 24 | Pemiscot | $33,945 |
| 25 | Carter | $33,349 |
| 26 | Ripley | $33,101 |
| 27 | Oregon | $31,637 |
| 28 | Shannon | $30,102 |
Education
Public school districts
Public Universities
- Southeast Missouri State University - Cape Girardeau
- Southeast Missouri State University-Kennett (Satellite Campus)
- Southeast Missouri State University-Malden (Satellite Campus)
- Perryville Area Higher Education Center (PAHEC) - Perryville (Satellite Campus)
- Sikeston Area Higher Education Center (SAHEC) - Sikeston (Satellite Campus)
- Southeast Missouri Hospital College of Nursing
- Missouri University of Science and Technology - Rolla (Formerly known as the University of Missouri-Rolla [UMR])
- Missouri State University - Springfield (Formerly known as Southwest Missouri State University) - Located in Missouri's 7th congressional district
- Missouri State University-Mountain Grove (Satellite Campus)
- Missouri State University-West Plains (Satellite Campus)
Community Colleges
- Mineral Area College - Park Hills
- Mineral Area Regional Medical Center School of Radiation Technology
- Three Rivers Community College - Poplar Bluff
Historical district boundaries
See also
- Missouri's congressional districts
- List of United States congressional districts
- Missouri's 8th congressional district special election, 2013
- 2012 House of Representatives election in Missouri 8th district
References
- Martis, Kenneth C. (1989). The Historical Atlas of Political Parties in the United States Congress. New York: Macmillan Publishing Company.
- Martis, Kenneth C. (1982). The Historical Atlas of United States Congressional Districts. New York: Macmillan Publishing Company.
- Congressional Biographical Directory of the United States 1774–present
Coordinates: 37°11′39″N 90°56′04″W / 37.19417°N 90.93444°W