Howell County, Missouri
| Howell County, Missouri | |
|---|---|
 Howell County Courthouse in West Plains | |
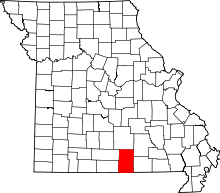 Location in the U.S. state of Missouri | |
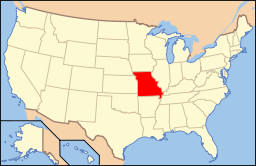 Missouri's location in the U.S. | |
| Founded | March 2, 1857 |
| Named for | Josiah Howell, pioneer settler |
| Seat | West Plains |
| Largest city | West Plains |
| Area | |
| • Total | 928 sq mi (2,404 km2) |
| • Land | 927 sq mi (2,401 km2) |
| • Water | 1.1 sq mi (3 km2), 0.1% |
| Population (est.) | |
| • (2015) | 40,117 |
| • Density | 44/sq mi (17/km²) |
| Congressional district | 8th |
| Time zone | Central: UTC-6/-5 |
| Website |
www |
Howell County is a county located in the southern portion of the U.S. state of Missouri. As of the 2010 census, the population was 40,400.[1] The largest city and county seat is West Plains.[2] The county was officially organized on March 2, 1851, and is named after Josiah Howell, a pioneer settler in the Howell Valley.
Howell County comprises the West Plains, MO Micropolitan Statistical Area.
History
Howell County was organized on March 2, 1857, from Oregon County, and is named for Josiah Howell, who made the first settlement in Howell Valley.
The first Circuit Court met in a log cabin one mile east of West Plains, according to an 1876 account. A small, wooden courthouse was built on the square in West Plains in 1859. It was damaged during the Civil War in 1862. The county was reorganized three years later, but all of the county records were destroyed in an 1866 fire. A second courthouse was built in West Plains in 1869. It was a small, three-room, frame building, about 24 by 30 feet.
Geography
According to the U.S. Census Bureau, the county has a total area of 928 square miles (2,400 km2), of which 927 square miles (2,400 km2) is land and 1.1 square miles (2.8 km2) (0.1%) is water.[3] It is the third-largest county in Missouri by land area and fourth-largest by total area.
Adjacent counties
- Texas County (north)
- Shannon County (northeast)
- Oregon County (east)
- Fulton County, Arkansas (south)
- Ozark County (southwest)
- Douglas County (northwest)
Major highways
National protected area
- Mark Twain National Forest (part)
Demographics
| Historical population | |||
|---|---|---|---|
| Census | Pop. | %± | |
| 1860 | 3,169 | — | |
| 1870 | 4,218 | 33.1% | |
| 1880 | 8,814 | 109.0% | |
| 1890 | 18,618 | 111.2% | |
| 1900 | 21,834 | 17.3% | |
| 1910 | 21,065 | −3.5% | |
| 1920 | 21,102 | 0.2% | |
| 1930 | 19,672 | −6.8% | |
| 1940 | 22,270 | 13.2% | |
| 1950 | 22,725 | 2.0% | |
| 1960 | 22,027 | −3.1% | |
| 1970 | 23,521 | 6.8% | |
| 1980 | 28,807 | 22.5% | |
| 1990 | 31,447 | 9.2% | |
| 2000 | 37,238 | 18.4% | |
| 2010 | 40,400 | 8.5% | |
| Est. 2015 | 40,117 | [4] | −0.7% |
| U.S. Decennial Census[5] 1790-1960[6] 1900-1990[7] 1990-2000[8] 2010-2015[1] | |||
As of the census[9] of 2000, there were 37,238 people, 14,762 households, and 10,613 families residing in the county. The population density was 40 people per square mile (16/km²). There were 16,340 housing units at an average density of 18 per square mile (7/km²). The racial makeup of the county was 96.41% White, 0.31% Black or African American, 0.97% Native American, 0.36% Asian, 0.04% Pacific Islander, 0.28% from other races, and 1.63% from two or more races. Approximately 1.21% of the population were Hispanic or Latino of any race. Among the major first ancestries reported in Howell County were 28.3% American, 16.4% German, 12.2% Irish, and 12.1% English.
There were 14,762 households out of which 32.7% had children under the age of 18 living with them, 58.8% were married couples living together, 9.9% had a female householder with no husband present, and 28.10% were non-families. 25.0% of all households were made up of individuals and 12.3% had someone living alone who was 65 years of age or older. The average household size was 2.47 and the average family size was 2.94.
In the county the population was spread out with 26.0% under the age of 18, 7.8% from 18 to 24, 26.2% from 25 to 44, 23.30% from 45 to 64, and 16.8% who were 65 years of age or older. The median age was 38 years. For every 100 females there were 93.6 males. For every 100 females age 18 and over, there were 88.5 males.
The median income for a household in the county was $31,761, and the median income for a family was $38,047. Males had a median income of $22,960 versus $16,968 for females. The per capita income for the county was $17,184. About 14.00% of families and 18.7% of the population were below the poverty line, including 26.3% of those under age 18 and 14.0% of those age 65 or over.
Religion
According to the Association of Religion Data Archives County Membership Report (2000), Howell County is a part of the Bible Belt with evangelical Protestantism being the majority religion. The most predominant denominations among residents in Howell County who adhere to a religion are Southern Baptists (47.70%), Churches of Christ (8.81%), and Roman Catholics (6.99%).
Education
Of adults 25 years of age and older in Howell County, 73.4% possesses a high school diploma or higher while 10.9% holds a bachelor's degree or higher as their highest educational attainment.
Public schools
- Mountain View-Birch Tree R-III School District - Mountain View
- Birch Tree Elementary School - Birch Tree - (PK-06) - Located in Shannon County
- Mountain View Elementary School - (PK-06)
- Liberty Middle School - (07-08)
- Liberty High School - (09-12)
- West Plains R-VII School District - West Plains
- South Fork Elementary School (K-06)
- West Plains Elementary School (K-04)
- West Plains Middle School (05-08)
- West Plains High School (09-12)
- Willow Springs R-IV School District - Willow Springs
- Willow Springs Elementary School (PK-04)
- Willow Springs Middle School (05-08)
- Willow Springs High School (09-12)
- Fairview R-XI School District - West Plains
- Fairview Elementary School (K-08)
- Glenwood R-VIII School District - West Plains
- Glenwood Elementary School - (PK-08)
- Howell Valley R-I School District - West Plains
- Howell Valley Elementary School (K-08)
- Junction Hill C-12 School District - West Plains
- Junction Hill Elementary School - (K-08)
- Richards R-V School District - West Plains
- Richards Elementary School - (K-08)
Private schools
- Faith Assembly Christian School - West Plains - (PK-12) - Assemblies of God/Pentecostal
- Ozarks Christian Academy - West Plains - (K-10) - non denominational/Protestant - Classical Christian Education
- Trinity Christian Academy - Mountain View - (K-12) - Pentecostal - Wade St., Mountain View.
Alternative and vocational schools
- Ozark Horizon State School - West Plains - (K-12) - A school for handicapped students and those with other special needs.
- South Central Career Center - West Plains - (09-12) - Vocational/technical
Colleges and universities
- Missouri State University-West Plains - A satellite campus of Missouri State University
Politics
Local
The Republican Party predominantly controls politics at the local level in Howell County. Republicans hold all of the elected positions in the county.
| Howell County, Missouri | ||||
|---|---|---|---|---|
| Elected countywide officials | ||||
| Assessor | Daniel Franks | Republican | ||
| Circuit Clerk | Cindy Weeks | Republican | ||
| County Clerk | Dennis K. Von Allmen | Republican | ||
| Collector | Larry Spence | Republican | ||
| Commissioner (Presiding) |
Mark B. Collins | Republican | ||
| Commissioner (District 1) |
Bill Lovelace | Republican | ||
| Commissioner (District 2) |
Billy D. Sexton | Republican | ||
| Coroner | James T. "Tim" Cherry | Republican | ||
| Prosecuting Attorney | Michael P. Hutchings | Republican | ||
| Public Administrator | Charm L. Eagleman | Republican | ||
| Recorder | Sharon Trowbridge | Republican | ||
| Sheriff | James M. "Mike" Shannon | Republican | ||
| Surveyor | Ralph Riggs | Republican | ||
| Treasurer | Ernestine Doss | Republican | ||
State
| Year | Republican | Democratic | Third Parties |
|---|---|---|---|
| 2012 | 54.23% 8,849 | 42.59% 6,950 | 3.19% 520 |
| 2008 | 45.33% 7,659 | 52.11% 8,804 | 2.56% 432 |
| 2004 | 64.89% 10,595 | 33.48% 5,466 | 1.63% 267 |
| 2000 | 53.51% 7,537 | 44.77% 6,306 | 1.72% 242 |
| 1996 | 51.71% 7,030 | 44.78% 6,087 | 3.51% 477 |
| 1992 | 48.26% 6,401 | 51.74% 6,862 | 0.00% 0 |
| 1988 | 71.70% 8,321 | 27.69% 3,214 | 0.61% 71 |
| 1984 | 70.90% 8,476 | 29.10% 3,479 | 0.00% 0 |
| 1980 | 59.53% 6,956 | 40.32% 4,711 | 0.15% 18 |
| 1976 | 57.07% 5,673 | 42.77% 4,251 | 0.16% 16 |
| 1972 | 61.53% 6,296 | 38.40% 3,929 | 0.07% 7 |
| 1968 | 48.33% 4,605 | 51.67% 4,923 | 0.00% 0 |
| 1964 | 47.58% 4,453 | 52.42% 4,905 | 0.00% 0 |
| 1960 | 64.55% 6,166 | 35.45% 3,386 | 0.00% 0 |
In the Missouri House of Representatives, Howell County is divided into two legislative districts, both of which are represented by Republicans.
- District 154 – Consists of most of the entire county and includes the entire city of West Plains as well as the communities of Willow Springs, Brandsville, Pomona, and South Fork. Shawn Rhoads, a Republican from West Plains, was elected in 2012 to his first term in the Missouri House in this newly redrawn district.
- District 142 – Consists of a tiny sliver of the extreme northeastern corner of the county and takes in the entirety of the city of Mountain View. Robert Ross, a Republican from Yukon, was elected in 2012 to his first term in the Missouri House in this newly redrawn district.
In the Missouri Senate, all of Howell County is a part of Missouri’s 33rd District and is currently represented by Republican Mike Cunningham of Caulfield. Cunningham ran unopposed in 2012 and was elected to his first term in the Missouri Senate to succeed fellow Republican Chuck Purgason, also of Caulfield. Purgason successfully served two terms/eight years in the Missouri Senate and was ineligible to seek a third term due to term limits.
Federal
Missouri's two U.S. Senators are Democrat Claire McCaskill of Kirkwood and Republican Roy Blunt of Strafford.
McCaskill was reelected to her second term in 2012 with 54.81 percent of the statewide vote over former Republican U.S. Representative W. Todd Akin of Town & Country and Libertarian Jonathan Dine of Riverside; Howell County, however, backed Akin with just over 51 and a quarter percent of the vote.
| Party | Candidate | Votes | % | ± | |
|---|---|---|---|---|---|
| Republican | W. Todd Akin | 8,340 | 51.35 | ||
| Democratic | Claire McCaskill | 6,692 | 41.20 | ||
| Libertarian | Jonathan Dine | 1,210 | 7.45 | ||
Blunt was elected to his first term in 2010 with 54.23 percent of the statewide vote over former Democratic Missouri Secretary of State Robin Carnahan, Libertarian Jonathan Dine of Riverside, and Constitutionalist Jerry Beck of Novelty; Howell County voters backed Blunt with just under 66 percent of the vote.
| Party | Candidate | Votes | % | ± | |
|---|---|---|---|---|---|
| Republican | Roy Blunt | 7,752 | 65.91 | ||
| Democratic | Robin Carnahan | 3,176 | 27.00 | ||
| Libertarian | Jonathan Dine | 436 | 3.71 | ||
| Constitution | Jerry Beck | 397 | 3.38 | ||
All of Howell County is included in Missouri's 8th Congressional District and is currently represented by Republican Jason T. Smith of Salem in the U.S. House of Representatives. Smith won a special election on Tuesday, June 4, 2013, to complete the remaining term of former Republican U.S. Representative Jo Ann Emerson of Cape Girardeau. Emerson announced her resignation a month after being reelected with over 70 percent of the vote in the district. She resigned to become CEO of the National Rural Electric Cooperative.
| Party | Candidate | Votes | % | ± | |
|---|---|---|---|---|---|
| Republican | Jo Ann Emerson | 12,456 | 77.20 | +9.61 | |
| Democratic | Jack Rushin | 2,895 | 17.94 | -9.16 | |
| Libertarian | Rick Vandeven | 784 | 4.86 | +2.37 | |
| Party | Candidate | Votes | % | ± | |
|---|---|---|---|---|---|
| Republican | Jason T. Smith | 2,268 | 69.04 | ||
| Democratic | Steve Hodges | 614 | 18.69 | ||
| Constitution | Doug Enyart | 340 | 10.35 | ||
| Libertarian | Bill Slantz | 63 | 1.92 | ||
Political culture
| Year | Republican | Democratic | Others |
|---|---|---|---|
| 2016 | 79.60% 13,888 | 16.51% 2,880 | 3.90% 680 |
| 2012 | 70.62% 11,544 | 26.89% 4,395 | 2.49% 407 |
| 2008 | 64.49% 10,982 | 33.68% 5,736 | 1.83% 311 |
| 2004 | 67.75% 11,097 | 31.25% 5,118 | 1.00% 164 |
| 2000 | 64.07% 9,018 | 32.97% 4,641 | 2.96% 416 |
| 1996 | 44.30% 5,991 | 38.90% 5,261 | 16.80% 2,272 |
| 1992 | 39.60% 5,360 | 40.57% 5,492 | 19.58% 2,650 |
| 1988 | 62.49% 7,277 | 37.13% 4,324 | 0.38% 44 |
| 1984 | 68.53% 8,204 | 31.47% 3,767 | 0.00% 0 |
| 1980 | 60.06% 7,149 | 37.57% 4,472 | 2.37% 282 |
| 1976 | 46.76% 4,692 | 52.47% 5,265 | 0.78% 78 |
| 1972 | 72.18% 7,253 | 27.82% 2,795 | 0.00% 0 |
| 1968 | 57.24% 5,631 | 28.08% 2,763 | 14.68% 1,444 |
| 1964 | 48.25% 4,632 | 51.75% 4,968 | 0.00% 0 |
| 1960 | 72.18% 7,095 | 27.82% 2,734 | 0.00% 0 |
Howell County is, like several rural counties located in the Ozarks, conservative and strongly Republican at the presidential level. Bill Clinton of neighboring Arkansas was the last Democratic presidential nominee to win Howell County in 1992; he lost the county during his 1996 reelection bid and since then, voters in Howell County have decisively backed Republicans. Controversy occurred during the course of the 2008 presidential campaign over a billboard displayed near West Plains that depicted a picture of then-Democratic presidential nominee Barack Obama in a turban. Some were offended by the billboard and deemed it racist.[10]
Like most rural areas throughout Southeast Missouri, voters in Howell County generally adhere to socially and culturally conservative principles which tend to influence their Republican leanings. In 2004, Missourians voted on a constitutional amendment to define marriage as the union between a man and a woman—it overwhelmingly won in Howell County with 83.36 percent of the vote. The initiative passed the state with 71 percent of support from voters. In 2006, Missourians voted on a constitutional amendment to fund and legalize embryonic stem cell research in the state—it failed in Howell County with 57.97 percent voting against the measure. The initiative narrowly passed the state with 51 percent of support from voters as Missouri became one of the first states in the nation to approve embryonic stem cell research. Despite Howell County's longstanding tradition of supporting socially conservative platforms, voters in the county have a penchant for advancing populist causes like increasing the minimum wage. In 2006, Missourians voted on a proposition (Proposition B) to increase the minimum wage in the state to $6.50 an hour—it passed Howell County with 67.79 percent of the vote. The proposition strongly passed every single county in Missouri with 78.99 percent voting in favor. (During the same election, voters in five other states also strongly approved increases in the minimum wage.)
Missouri Presidential Preference Primary (2008)
In the 2008 Missouri Presidential Primary, voters in Howell County from both political parties supported candidates who finished in second place in the state at large and nationally.
- Former Governor Mike Huckabee (R-Arkansas) received more votes, a total of 2,882, than any candidate from either party in Howell County during the 2008 Missouri Presidential Preference Primary.
| Howell County, Missouri | ||
|---|---|---|
| 2008 Republican primary in Missouri | ||
| John McCain | 1,347 (24.76%) | |
| Mike Huckabee | 2,882 (52.97%) | |
| Mitt Romney | 793 (14.57%) | |
| Ron Paul | 356 (6.54%) | |
| Howell County, Missouri | ||
|---|---|---|
| 2008 Democratic primary in Missouri | ||
| Hillary Clinton | 2,307 (64.07%) | |
| Barack Obama | 1,168 (32.44%) | |
| John Edwards (withdrawn) | 99 (2.75%) | |
| Uncommitted | 14 (1.06%) | |
Communities
See also
References
- 1 2 "State & County QuickFacts". United States Census Bureau. Retrieved September 9, 2013.
- ↑ "Find a County". National Association of Counties. Retrieved 2011-06-07.
- ↑ "2010 Census Gazetteer Files". United States Census Bureau. August 22, 2012. Retrieved November 16, 2014.
- ↑ "County Totals Dataset: Population, Population Change and Estimated Components of Population Change: April 1, 2010 to July 1, 2015". Retrieved July 2, 2016.
- ↑ "U.S. Decennial Census". United States Census Bureau. Retrieved November 16, 2014.
- ↑ "Historical Census Browser". University of Virginia Library. Retrieved November 16, 2014.
- ↑ "Population of Counties by Decennial Census: 1900 to 1990". United States Census Bureau. Retrieved November 16, 2014.
- ↑ "Census 2000 PHC-T-4. Ranking Tables for Counties: 1990 and 2000" (PDF). United States Census Bureau. Retrieved November 16, 2014.
- ↑ "American FactFinder". United States Census Bureau. Retrieved 2008-01-31.
- ↑ The Washington Post, Retrieved July 27, 2013.
External links
- Howell County, Missouri
- Howell County Courthouse, MU Extension
- Digitized 1930 Plat Book of Howell County from University of Missouri Division of Special Collections, Archives, and Rare Books
 |
Texas County | Texas County | Shannon County | |
| Douglas County and Ozark County | |
Oregon County | ||
| ||||
| | ||||
| Fulton County, Arkansas |
Municipalities and communities of Howell County, Missouri, United States | ||
|---|---|---|
| Cities | | |
| Townships | ||
| CDPs | ||
| Other unincorporated communities | ||
| Ghost towns | ||
Coordinates: 36°46′N 91°53′W / 36.77°N 91.89°W