Shelby County, Missouri
| Shelby County, Missouri | |
|---|---|
 Shelby County Courthouse in Shelbyville | |
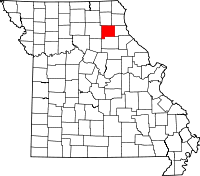 Location in the U.S. state of Missouri | |
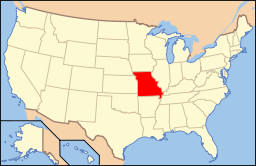 Missouri's location in the U.S. | |
| Founded | January 2, 1835 |
| Named for | Isaac Shelby |
| Seat | Shelbyville |
| Largest city | Shelbina |
| Area | |
| • Total | 502 sq mi (1,300 km2) |
| • Land | 501 sq mi (1,298 km2) |
| • Water | 1.5 sq mi (4 km2), 0.3% |
| Population (est.) | |
| • (2015) | 6,128 |
| • Density | 13/sq mi (5/km²) |
| Congressional district | 6th |
| Time zone | Central: UTC-6/-5 |
Shelby County is a county located in the northeastern portion of the U.S. state of Missouri. As of the 2010 census, the population was 6,373.[1] Its county seat is Shelbyville.[2] The county was organized January 2, 1835 and named for Governor Isaac Shelby of Kentucky.[3]
Geography
According to the U.S. Census Bureau, the county has a total area of 502 square miles (1,300 km2), of which 501 square miles (1,300 km2) is land and 1.5 square miles (3.9 km2) (0.3%) is water.[4]
Adjacent counties
- Knox County (north)
- Lewis County (northeast)
- Marion County (east)
- Monroe County (south)
- Randolph County (southwest)
- Macon County (west)
Major highways
 Interstate 72 (Proposed)
 U.S. Route 36
 Route 15
 Route 151
 Route 168
Demographics
| Historical population | |||
|---|---|---|---|
| Census | Pop. | %± | |
| 1840 | 3,056 | — | |
| 1850 | 4,253 | 39.2% | |
| 1860 | 7,301 | 71.7% | |
| 1870 | 10,119 | 38.6% | |
| 1880 | 14,024 | 38.6% | |
| 1890 | 15,642 | 11.5% | |
| 1900 | 16,167 | 3.4% | |
| 1910 | 14,864 | −8.1% | |
| 1920 | 13,617 | −8.4% | |
| 1930 | 11,983 | −12.0% | |
| 1940 | 11,224 | −6.3% | |
| 1950 | 9,730 | −13.3% | |
| 1960 | 9,063 | −6.9% | |
| 1970 | 7,906 | −12.8% | |
| 1980 | 7,826 | −1.0% | |
| 1990 | 6,942 | −11.3% | |
| 2000 | 6,799 | −2.1% | |
| 2010 | 6,373 | −6.3% | |
| Est. 2015 | 6,128 | [5] | −3.8% |
| U.S. Decennial Census[6] 1790-1960[7] 1900-1990[8] 1990-2000[9] 2010-2015[1] | |||
As of the census[10] of 2000, there were 6,799 people, 2,745 households, and 1,847 families residing in the county. The population density was 14 people per square mile (5/km²). There were 3,245 housing units at an average density of 6 per square mile (2/km²). The racial makeup of the county was 97.87% White, 0.97% Black or African American, 0.28% Native American, 0.10% Asian, 0.19% from other races, and 0.59% from two or more races. Approximately 0.63% of the population were Hispanic or Latino of any race. 30.4% were of American, 26.9% German, 14.9% English and 8.5% Irish ancestry.
There were 2,745 households out of which 30.60% had children under the age of 18 living with them, 56.90% were married couples living together, 7.30% had a female householder with no husband present, and 32.70% were non-families. 30.30% of all households were made up of individuals and 16.60% had someone living alone who was 65 years of age or older. The average household size was 2.38 and the average family size was 2.98.
In the county the population was spread out with 25.40% under the age of 18, 7.20% from 18 to 24, 24.40% from 25 to 44, 23.30% from 45 to 64, and 19.70% who were 65 years of age or older. The median age was 40 years. For every 100 females there were 91.60 males. For every 100 females age 18 and over, there were 90.00 males.
The median income for a household in the county was $29,448, and the median income for a family was $35,944. Males had a median income of $25,759 versus $18,996 for females. The per capita income for the county was $15,632. About 13.00% of families and 16.30% of the population were below the poverty line, including 21.70% of those under age 18 and 14.10% of those age 65 or over.
Education
Public schools
- North Shelby School District – Shelbyville
- North Shelby Elementary School (K-06)
- North Shelby High School (07-12)
- Shelby County R-IV School District – Shelbina
- Shelbina Elementary School (PK-05)
- Clarence Elementary School (PK-05)
- South Shelby Middle School (06-08)
- South Shelby High School (09-12)
Private schools
- Shiloh Christian School – Shelbina (K-12) – Nondenominational Christian – Alternative School
- Heartland Christian Academy (Official Site) – Bethel (PK-12) – Nondenominational Christian
Politics
Local
The Democratic Party predominantly controls politics at the local level in Shelby County. Democrats hold all but one of the elected positions in the county.
| Shelby County, Missouri | ||||
|---|---|---|---|---|
| Elected countywide officials | ||||
| Assessor | Marge Gander | Democratic | ||
| Circuit Clerk | Rosalie (Rose) Shively | Democratic | ||
| County Clerk | Tracy Smith | Democratic | ||
| Collector | John Chinn | Democratic | ||
| Commissioner (Presiding) |
Glenn Eagan | Democratic | ||
| Commissioner (District 1) |
Maurice Shuck | Democratic | ||
| Commissioner (District 2) |
Kerry McCarty | Democratic | ||
| Coroner | Ralph Eagan | Democratic | ||
| Prosecuting Attorney | Jordan Rogers | Democratic | ||
| Public Administrator | Susan C. Wilt | Republican | ||
| Recorder | Audrey Grawe Buzzard | Democratic | ||
| Sheriff | Dennis Perrigo | Democratic | ||
| Surveyor | Martin T. Wasson | Democratic | ||
| Treasurer | Jesse C. Burton | Democratic | ||
State
| Year | Republican | Democratic | Third Parties |
|---|---|---|---|
| 2012 | 53.58% 1,721 | 44.40% 1,426 | 2.02% 65 |
| 2008 | 63.15% 2,094 | 35.86% 1,189 | 0.99% 33 |
| 2004 | 66.72% 2,316 | 32.15% 1,116 | 1.13% 39 |
| 2000 | 51.50% 1,668 | 47.76% 1,547 | 0.74% 24 |
| 1996 | 28.12% 859 | 70.51% 2,154 | 1.37% 42 |
Shelby County is a part of Missouri’s 5th District in the Missouri House of Representatives and is represented by Lindell F Shumake (R-Hannibal).
| Party | Candidate | Votes | % | ± | |
|---|---|---|---|---|---|
| Republican | Lindell F. Shumake | 1,149 | 67.91 | +30.42 | |
| Democratic | C. Leroy Deichman | 543 | 32.09 | -30.42 | |
| Party | Candidate | Votes | % | ± | |
|---|---|---|---|---|---|
| Republican | Lindell F. Shumake | 1,215 | 37.49 | ||
| Democratic | Tom Shively | 2,026 | 62.51 | ||
Shelby County is a part of Missouri’s 18th District in the Missouri Senate and is currently represented by Brian Munzlinger (R-Williamstown).
| Party | Candidate | Votes | % | ± | |
|---|---|---|---|---|---|
| Republican | Brian Munzlinger | 1,375 | 100.00 | +48.49 | |
| Party | Candidate | Votes | % | ± | |
|---|---|---|---|---|---|
| Republican | Brian Munzlinger | 1,450 | 51.51 | ||
| Democratic | Wes Shoemyer | 1,365 | 48.49 | ||
Federal
| Party | Candidate | Votes | % | ± | |
|---|---|---|---|---|---|
| Republican | Todd Akin | 1,667 | 51.77 | ||
| Democratic | Claire McCaskill | 1,424 | 44.22 | ||
| Libertarian | Jonathan Dine | 129 | 4.011 | ||
Shelby County is included in Missouri’s 6th Congressional District and is currently represented by Sam Graves (R-Tarkio) in the U.S. House of Representatives.
| Party | Candidate | Votes | % | ± | |
|---|---|---|---|---|---|
| Republican | Sam Graves | 1,212 | 71.76 | +4.76 | |
| Democratic | Bill Hedge | 454 | 26.88 | -4.30 | |
| Libertarian | Russ Lee Monchil | 23 | 1.36 | -0.46 | |
| Party | Candidate | Votes | % | ± | |
|---|---|---|---|---|---|
| Republican | Sam Graves | 2,091 | 67.00 | ||
| Democratic | Kyle Yarber | 973 | 31.18 | ||
| Libertarian | Russ Lee Monchil | 57 | 1.82 | ||
| Year | Republican | Democratic | Third Parties |
|---|---|---|---|
| 2012 | 67.70% 2,188 | 29.89% 966 | 2.41% 78 |
| 2008 | 65.32% 2,166 | 33.59% 1,114 | 1.09% 36 |
| 2004 | 65.11% 2,280 | 34.29% 1,201 | 0.60% 21 |
| 2000 | 59.44% 1,936 | 38.75% 1,262 | 1.81% 59 |
| 1996 | 39.64% 1,213 | 46.08% 1,410 | 14.28% 437 |
Missouri Presidential Preference Primary (2008)
- Former U.S. Senator Hillary Clinton (D-New York) received more votes, a total of 460, than any candidate from either party in Shelby County during the 2008 presidential primary.
| Shelby County, Missouri | ||
|---|---|---|
| 2008 Republican primary in Missouri | ||
| John McCain | 206 (29.43%) | |
| Mike Huckabee | 321 (45.86%) | |
| Mitt Romney | 140 (20.00%) | |
| Ron Paul | 18 (2.57%) | |
| Shelby County, Missouri | ||
|---|---|---|
| 2008 Democratic primary in Missouri | ||
| Hillary Clinton | 460 (54.37%) | |
| Barack Obama | 299 (35.34%) | |
| John Edwards (withdrawn) | 64 (7.57%) | |
| Uncommitted | 19 (2.25%) | |
Communities
- Bethel
- Cherry Box
- Clarence
- Emden
- Hunnewell
- Lakenan
- Lentner
- Leonard
- Shelbina
- Shelbyville (county seat)
Notable residents
- Norm Stewart, legendary University of Missouri basketball coach (from Shelbyville)
- Randall Duke Cunningham, only U.S. Navy fighter ace of the Vietnam War, former Republican U.S. Representative from California (raised in Shelbina)
- Frank Hamilton Short, conservationist and advocate for states' rights and private development of natural resources in the early 20th century (born in Shelby County in 1862)
- Sam Walton, founder of Wal-Mart
- James Earl Ray, assassin of Martin Luther King Jr, lived in Shelbina for a brief time.
See also
References
- 1 2 "State & County QuickFacts". United States Census Bureau. Retrieved September 14, 2013.
- ↑ "Find a County". National Association of Counties. Retrieved 2011-06-07.
- ↑ Eaton, David Wolfe (1918). How Missouri Counties, Towns and Streams Were Named. The State Historical Society of Missouri. p. 364.
- ↑ "2010 Census Gazetteer Files". United States Census Bureau. August 22, 2012. Retrieved November 22, 2014.
- ↑ "County Totals Dataset: Population, Population Change and Estimated Components of Population Change: April 1, 2010 to July 1, 2015". Retrieved July 2, 2016.
- ↑ "U.S. Decennial Census". United States Census Bureau. Retrieved November 22, 2014.
- ↑ "Historical Census Browser". University of Virginia Library. Retrieved November 22, 2014.
- ↑ "Population of Counties by Decennial Census: 1900 to 1990". United States Census Bureau. Retrieved November 22, 2014.
- ↑ "Census 2000 PHC-T-4. Ranking Tables for Counties: 1990 and 2000" (PDF). United States Census Bureau. Retrieved November 22, 2014.
- ↑ "American FactFinder". United States Census Bureau. Retrieved 2008-01-31.
Further reading
- General History Of Shelby County Missouri (1911) online
External links
- Digitized 1930 Plat Book of Shelby County from University of Missouri Division of Special Collections, Archives, and Rare Books
 |
Knox County | Lewis County | | |
| Macon County | |
Marion County | ||
| ||||
| | ||||
| Randolph County | Monroe County |
Municipalities and communities of Shelby County, Missouri, United States | ||
|---|---|---|
| Cities | | |
| Villages | ||
| Unincorporated communities | ||
Coordinates: 39°47′N 92°04′W / 39.79°N 92.07°W