United States presidential election in Alabama, 2016

|
|
|
|
|

|
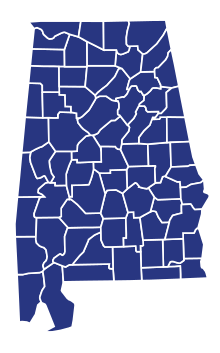
County Results
|
Trump—50-60%
Trump—60-70%
Trump—70-80%
Trump—80-90%
|
Clinton—50-60%
Clinton—60-70%
Clinton—70-80%
Clinton—80-90%
|
|
|
|
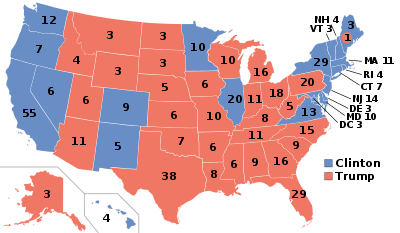
The 2016 United States presidential election in Alabama was held on November 8, 2016, as part of the 2016 General Election in which all 50 states plus The District of Columbia participated. Alabama voters chose electors to represent them in the Electoral College via a popular vote pitting the Republican Party's nominee, businessman Donald Trump, and running mate Indiana Governor Mike Pence against Democratic Party nominee, former Secretary of State Hillary Clinton and her running mate, Virginia Senator Tim Kaine.
On March 1, 2016, in the presidential primaries, Alabama voters expressed their preferences for the Democratic, Republican, and Libertarian parties' respective nominees for President. Registered members of each party only voted in their party's primary, while voters who were unaffiliated chose any one primary in which to vote. Alabama has voted for the Republican candidate in every election since it was won by Ronald Reagan in 1980.
Donald Trump won the election in Alabama with 62.9% of the vote. Hillary Clinton received 34.6% of the vote.[1]
Background
The incumbent President of the United States, Barack Obama, a Democrat and former U.S. Senator from Illinois, was first elected president in the 2008 election, running with former Senator Joe Biden of Delaware. Defeating the Republican nominee, Senator John McCain of Arizona, with 52.9% of the popular vote and 68% of the electoral vote,[2][3] Obama succeeded two-term Republican President George W. Bush, the former Governor of Texas. Obama and Biden were reelected in the 2012 presidential election, defeating former Massachusetts Governor Mitt Romney with 51.1% of the popular vote and 61.7% of electoral votes.[4] Although Barack Obama's approval rating in the RealClearPolitics poll tracking average remained between 40 and 50 percent for most of his second term, it has experienced a surge in early 2016 and reached its highest point since 2012 during June of that year.[5][6] Analyst Nate Cohn has noted that a strong approval rating for President Obama would equate to a strong performance for the Democratic candidate, and vice versa.[7]
Following his second term, President Obama is not eligible for another reelection. In October 2015, Obama's running-mate and two-term Vice President Biden decided not to enter the race for the Democratic Presidential nomination either.[8] With their term expiring on January 20, 2017, the electorate is asked to elect a new president, the 45th President and 48th Vice President of the United States, respectively.
General election
Statewide results
Results by county
| County | Trump# | Trump% | Clinton# | Clinton% | Johnson# | Johnson% | Stein# | Stein% | Write-ins# | Write-ins% | Total Votes | Turnout |
| Autauga | 18,110 | 72.82% | 5,908 | 23.75% | 538 | 2.16% | 105 | 0.42% | 210 | 0.84% | 24,871 | 65.51% |
| Baldwin | 72,780 | 76.58% | 18,409 | 19.37% | 2,448 | 2.58% | 453 | 0.48% | 954 |
1.00% | 95,044 | 65.15% |
| Barbour | 5,431 | 52.11% | 4,848 | 46.51% | 93 | 0.89% | 18 | 0.17% | 33 | 0.32% |
10,423 | 61.41% |
| Bibb | 6,733 | 76.39% | 1,874 | 21.26% | 124 | 1.41% | 17 | 0.19% | 66 | 0.75% | 8,814 | 65.47% |
| Blount | 22,808 | 89.34% | 2,150 | 8.42% | 337 | 1.32% | 89 | 0.35% | 146 | 0.57% | 25,530 | 68.20% |
| Bullock | 1,139 | 24.19% | 3,530 | 74.96% | 22 | 0.47% | 10 | 0.21% | 8 | 0.17% | 4,709 | 63.90% |
| Butler | 4,891 | 56.14% | 3,716 | 42.65% | 65 | 0.75% | 13 | 0.15% | 27 | 0.31% | 8,712 | 63.48% |
| Calhoun | 32,803 | 68.69% | 13,197 | 27.64% | 1,114 | 2.33% | 262 | 0.55% | 378 | 0.79% | 47,754 | 64.46% |
| Chambers | 7,803 | 56.38% | 5,763 | 41.64% | 168 | 1.21% | 44 | 0.32% | 61 | 0.44% | 13,839 | 57.91% |
| Cherokee | 8,937 | 83.41% | 1,545 | 14.42% | 147 | 1.37% | 26 | 0.24% | 60 | 0.56% | 10,715 | 63.84% |
| Chilton | 15,068 | 82.11% | 2,909 | 15.85% | 226 | 1.23% | 52 | 0.28% | 96 | 0.52% | 18,351 | 64.59% |
| Choctaw | 4,102 | 56.29% | 3,109 | 42.67% | 51 | 0.70% | 6 | 0.08% | 19 | 0.26% | 7,287 | 66.74% |
| Clarke | 7,109 | 54.84% | 5,712 | 44.07% | 98 | 0.76% | 17 | 0.13% | 26 | 0.20% | 12,962 | 67.22% |
| Clay | 5,230 | 79.18% | 1,234 | 18.68% | 92 | 1.39% | 16 | 0.24% | 33 | 0.50% | 6,605 | 65.10% |
| Cleburne | 5,738 | 87.38% | 684 | 10.42% | 90 | 1.37% | 20 | 0.30% | 35 | 0.53% | 6,567 | 61.19% |
| Coffee | 15,825 | 76.51% | 4,194 | 20.28% | 392 | 1.90% | 102 | 0.49% | 171 | 0.83% | 20,684 | 62.63% |
| Colbert | 16,718 | 67.24% | 7,296 | 29.34% | 506 | 2.04% | 106 | 0.43% | 238 | 0.96% | 24,864 | 65.28% |
| Conecuh | 3,413 | 51.97% | 3,069 | 46.73% | 51 | 0.78% | 10 | 0.15% | 24 | 0.37% | 6,567 | 63.14% |
| Coosa | 3,376 | 64.37% | 1,780 | 33.94% | 53 | 1.01% | 14 | 0.27% | 22 | 0.42% | 5,245 | 65.07% |
| Covington | 13,222 | 83.24% | 2,379 | 14.98% | 181 | 1.14% | 36 | 0.23% | 66 | 0.42% | 15,884 | 63.09% |
| Crenshaw | 4,511 | 72.03% | 1,663 | 26.55% | 64 | 1.02% | 14 | 0.22% | 11 | 0.18% | 6,263 | 63.32% |
| Cullman | 32,734 | 87.20% | 3,730 | 9.94% | 682 | 1.82% | 132 | 0.35% | 260 | 0.69% | 37,538 | 67.52% |
| Dale | 13,789 | 73.66% | 4,408 | 23.53% | 349 | 1.86% | 62 | 0.33% | 115 | 0.62% | 18,732 | 59.92% |
| Dallas | 5,784 | 30.80% | 12,826 | 68.31% | 96 | 0.51% | 24 | 0.13% | 47 | 0.25% | 18,777 | 58.15% |
| DeKalb | 21,779 | 82.88% | 3,682 | 14.01% | 469 | 1.78% | 156 | 0.59% | 192 | 0.73% | 26,278 | 64.69% |
| Elmore | 27,619 | 74.17% | 8,436 | 22.65% | 738 | 1.98% | 112 | 0.30% | 332 | 0.89% | 37,237 | 69.29% |
| Escambia | 10,282% | 67.22% | 4,698 | 30.71% | 195 | 1.27% | 38 | 0.25% | 84 | 0.55% | 15,297 | 61.34% |
| Etowah | 32,132 | 73.29% | 10,350 | 23.61% | 829 | 1.89% | 163 | 0.37% | 366 | 0.83% | 43,840 | 63.64% |
| Fayette | 6,705 | 81.40% | 1,358 | 16.49% | 109 | 1.32% | 24 | 0.29% | 41 | 0.50% | 8,237 | 68.20% |
| Franklin | 9,466 | 78.62% | 2,197 | 18.25% | 238 | 1.98% | 54 | 0.45% | 85 | 0.71% | 12,040 | 64.30% |
| Geneva | 9,967 | 85.01% | 1,522 | 12.98% | 147 | 1.25% | 23 | 0.20% | 66 | 0.56% | 11,725 | 65.73% |
| Greene | 838 | 17.20% | 4,006 | 82.21% | 13 | 0.27% | 5 | 0.10% | 11 | 0.23% | 4,873 | 66.90% |
| Hale | 3,172 | 39.47% | 4,772 | 59.38% | 54 | 0.67% | 12 | 0.15% | 26 | 0.32% | 8,036 | 64.18% |
| Henry | 5,623 | 69.79% | 2,286 | 28.37% | 91 | 1.13% | 17 | 0.21% | 40 | 0.50% | 8,057 | 63.82% |
| Houston | 30,567 | 72.17% | 10,547 | 24.90% | 722 | 1.82% | 144 | 0.34% | 322 | 0.76% | 42,352 | 61.23% |
| Jackson | 16,643 | 79.48% | 3,663 | 17.49% | 389 | 1.86% | 90 | 0.43% | 154 | 0.74% | 20,939 | 57.19% |
| Jefferson | 134,398 | 44.34% | 156,384 | 51.55% | 6,613 | 2.18% | 1,540 | 0.51% | 4,326 | 1.43% | 303,361 | 66.77% |
| Lamar | 5,819 | 83.59% | 1,035 | 14.87% | 62 | 0.89% | 15 | 0.22% | 30 | 0.43% | 6,961 | 64.35% |
| Lauderdale | 27,735 | 70.62% | 9,877 | 25.15% | 981 | 2.50% | 220 | 0.56% | 462 | 1.18% | 39,275 | 65.46% |
| Lawrence | 10,732% | 72.95% | 3,611 | 24.55% | 249 | 1.69% | 31 | 0.21% | 88 | 0.60% | 14,711 | 63.15% |
| Lee | 34,321 | 58.56% | 20,987 | 35.81% | 1,998 | 3.41% | 362 | 0.62% | 939 | 1.60% | 58,607 | 57.03% |
| Limestone | 28,824 | 72.24% | 9,340 | 23.41% | 1,036 | 2.60% | 200 | 0.50% | 499 | 1.25% | 39,899 | 69.05% |
| Lowndes | 1,751 | 26.20% | 4,882 | 73.05% | 32 | 0.48% | 11 | 0.16% | 7 | 0.10% | 6,683 | 64.46% |
| Macon | 1,394 | 15.89% | 7,237 | 82.49% | 69 | 0.79% | 48 | 0.55% | 25 | 0.28% | 8,773 | 47.64% |
| Madison | 89,199 | 54.85% | 62,435 | 38.39% | 6,591 | 4.05% | 1,248 | 0.77% | 3,161 | 1.94% | 162,634 | 62.27% |
| Marengo | 5,224 | 47.59% | 5,607 | 51.08% | 104 | 0.95% | 13 | 0.12% | 29 | 0.26% | 10,977 | 66.94% |
| Marion | 11,273 | 86.83% | 1,432 | 11.03% | 181 | 1.39% | 26 | 0.20% | 71 | 0.55% | 12,983 | 64.43% |
| Marshall | 29,217 | 82.78% | 4,913 | 13.92% | 677 | 1.92% | 158 | 0.45% | 329 | 0.93% | 35,294 | 63.69% |
| Mobile | 94,002 | 55.62% | 71,001 | 42.01% | 3,232 | 1.91% | 777 | 0.46% | 0 | 0.00% | 169,012 | 60.20% |
| Monroe | 5,771 | 56.46% | 4,310 | 42.16% | 88 | 0.86% | 16 | 0.16% | 37 | 0.36% | 10,222 | 62.75% |
| Montgomery | 33,928 | 35.51% | 58,669 | 61.40% | 1,486 | 1.56% | 489 | 0.51% | 981 | 1.03% | 95,553 | 62.14% |
| Morgan | 37,392 | 74.03% | 11,216 | 22.21% | 1,165 | 2.31% | 218 | 0.43% | 518 | 1.03% | 50,509 | 67.08% |
| Perry | 1,403 | 26.61% | 3,823 | 72.50% | 23 | 0.44% | 6 | 0.11% | 18 | 0.34% | 5,273 | 62.05% |
| Pickens | 5,454 | 57.17% | 3,972 | 41.64% | 49 | 0.51% | 19 | 0.20% | 46 | 0.48% | 9,540 | 68.47% |
| Pike | 7,681 | 58.46% | 5,039 | 38.35% | 257 | 1.96% | 48 | 0.37% | 114 | 0.87% | 13,139 | 58.74% |
| Randolph | 7,697 | 75.62% | 2,290 | 22.50% | 124 | 1.22% | 19 | 0.19% | 48 | 0.47% | 10,178 | 61.04% |
| Russell | 9,210 | 47.84 % | 9,577 | 49.75% | 281 | 1.46% | 68 | 0.35% | 116 | 0.60% | 19,252 | 53.55% |
| Shelby | 72,846 | 72.11% | 22,927 | 22.70% | 2,956 | 2.93% | 479 | 0.47% | 1,810 | 1.79% | 101,018 | 71.09% |
| St. Claire | 31,579 | 82.49% | 5,550 | 14.50% | 678 | 1.77% | 130 | 0.34% | 344 | 0.90% | 38,281 | 65.96% |
| Sumter | 1,581 | 24.69% | 4,739 | 74.00% | 57 | 0.89% | 14 | 0.22% | 13 | 0.20% | 6,404 | 62.87% |
| Talladega | 20,596 | 61.72% | 12,108 | 36.28% | 409 | 1.23% | 105 | 0.31% | 154 | 0.46% | 33,372 | 61.67% |
| Tallapoosa | 13,546 | 69.78% | 5,495 | 28.31% | 232 | 1.20% | 52 | 0.27% | 88 | 0.45% | 19,413 | 64.69% |
| Tuscaloosa | 47,701 | 57.71% | 31,746 | 38.41% | 1,871 | 2.26% | 390 | 0.47% | 952 | 1.15% | 82,660 | 62.65% |
| Walker | 24,208 | 82.33% | 4,486 | 15.26% | 454 | 1.54% | 95 | 0.32% | 159 | 0.54% | 29,402 | 63.46% |
| Washington | 6,031 | 70.84% | 2,366 | 27.79% | 73 | 0.86% | 22 | 0.26% | 22 | 0.26% | 8,514 | 62.87% |
| Wilcox | 1,737 | 28.44% | 4,329 | 70.87% | 22 | 0.36% | 7 | 0.11% | 13 | 0.21% | 6,108 | 64.78% |
| Winston | 9,225 | 89.50% | 871 | 8.45% | 130 | 1.26% | 29 | 0.28% | 52 | 0.50% | 10,307 | 62.21% |
Pie chart
Chart of popular vote
Trump (62.18%)
Clinton (34.33%)
Johnson (2.09%)
Write-ins (0.96%)
Stein (0.44%)
Turnout
According the Alabama Secretary of State website, voter turnout was 63.83% with 2,127,564 ballots cast out of 3,333,058 registered voters.[9]
Primary elections
Democratic primary

Results of the Democratic primary by county.
Hillary Clinton
Opinion polling
Results
Republican primary
Results of the Republican primary by county.
Donald Trump
| Alabama Republican primary, March 1, 2016 |
| Candidate |
Votes |
Percentage |
Actual delegate count |
| Bound |
Unbound |
Total |
 Donald Trump Donald Trump |
373,721 |
43.42% |
36 |
0 |
36 |
| Ted Cruz |
181,479 |
21.09% |
13 |
0 |
13 |
| Marco Rubio |
160,606 |
18.66% |
1 |
0 |
1 |
| Ben Carson |
88,094 |
10.24% |
0 |
0 |
0 |
| John Kasich |
38,119 |
4.43% |
0 |
0 |
0 |
| Uncommitted |
7,953 |
0.92% |
0 |
0 |
0 |
| Jeb Bush (withdrawn) |
3,974 |
0.46% |
0 |
0 |
0 |
| Mike Huckabee (withdrawn) |
2,539 |
0.30% |
0 |
0 |
0 |
| Rand Paul (withdrawn) |
1,895 |
0.22% |
0 |
0 |
0 |
| Chris Christie (withdrawn) |
858 |
0.10% |
0 |
0 |
0 |
| Rick Santorum (withdrawn) |
617 |
0.07% |
0 |
0 |
0 |
| Carly Fiorina (withdrawn) |
544 |
0.06% |
0 |
0 |
0 |
| Lindsey Graham (withdrawn) |
253 |
0.03% |
0 |
0 |
0 |
| Unprojected delegates: |
0 |
0 |
0 |
| Total: |
860,652 |
100.00% |
50 |
0 |
50 |
| Source: The Green Papers |
Opinion polls
See also
References
- ↑ "Alabama Election Results 2016 – The New York Times". Retrieved November 10, 2016.
- ↑ "United States House of Representatives floor summary for Jan 8, 2009". Clerk.house.gov. Retrieved January 30, 2009.
- ↑ "Federal elections 2008" (PDF). Federal Election Commission. Retrieved May 11, 2015.
- ↑ "President Map". The New York Times. November 29, 2012. Retrieved May 11, 2015.
- ↑ "Election Other – President Obama Job Approval". RealClearPolitics. Retrieved December 24, 2015.
- ↑ Byrnes, Jesse (2016-06-15). "Poll: Obama approval rating highest since 2012". TheHill. Retrieved 2016-06-19.
- ↑ Cohn, Nate (2015-01-19). "What a Rise in Obama's Approval Rating Means for 2016". The New York Times. ISSN 0362-4331. Retrieved 2016-06-19.
- ↑ "Joe Biden Decides Not to Enter Presidential Race". The Wall Street Journal. Retrieved October 21, 2015.
- 1 2 Merrill, John H. (November 10, 2016). "Unofficial Election Night Results". AlabamaVotes.gov. Alabama Secretary of State. Retrieved November 21, 2016.
External links
|
|---|
|
|
|
| Democratic Party | |
|---|
|
| Republican Party | |
|---|
|
| Libertarian Party | |
|---|
|
| Green Party | |
|---|
|
| Constitution Party | |
|---|
|
| Independent | |
|---|
|
|
|
|---|
|
| Election timelines | |
|---|
|
| National polling | |
|---|
|
| State polling | |
|---|
|
| Fundraising | |
|---|
|
| Debates and forums | |
|---|
|
| Straw polls | |
|---|
|
| Major events | |
|---|
|
Caucuses
and primaries | | |
|---|
| | |
|---|
| Libertarian Party | |
|---|
| Green Party | |
|---|
| Constitution Party | |
|---|
|
|---|
|
| Results breakdown | |
|---|
|
National
conventions | |
|---|
|
| Reforms | |
|---|