Demographics of New Brunswick
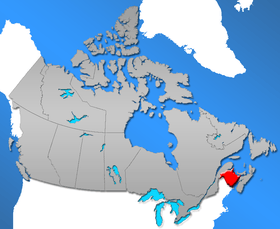
New Brunswick is one of Canada's three Maritime provinces, and the only officially bilingual province (French and English) in the country. The provincial Department of Finance estimates that the province's population in 2006 was 729,997 of which the majority is English-speaking but with a substantial (32%) French-speaking minority of mostly Acadian origin.
First Nations in New Brunswick include the Mi'kmaq and Wolastoqiyik (Maliseet). The first European settlers, the Acadians, are descendants of survivors of the Expulsion (1755) which drove several thousand French residents into exile in North America, the UK and France for refusing to take an oath of allegiance to King George II during the French and Indian War. American Acadians, who wound up in Louisiana and other parts of the American South, are often referred to as Cajuns.
Many of the English-Canadian population of New Brunswick are descended from Loyalists who fled the American Revolution. This is commemorated in the province's motto, Spem reduxit ("hope was restored"). There is also a significant population with Irish ancestry, especially in Saint John and the Miramichi Valley. People of Scottish descent are scattered throughout the Province with higher concentrations in the Miramichi and in Campbellton. A small population of Danish origin may be found in New Denmark in the northwest of the province.
Population
City Metropolitan Areas
| City | 2011 | 2006 | Land Area km² | Density /km² |
|---|---|---|---|---|
| Greater Moncton | 138,644 | 126,424 | 2,406.31 | 57.6 |
| Greater Saint John | 127,761 | 122,389 | 3,362.95 | 38.0 |
| Greater Fredericton | 94,268 | 85,688 | 4,886.40 | 19.3 |
| Greater Bathurst | 33,484 | 34,106 | 2,292.80 | 14.6 |
| Greater Miramichi | 28,115 | 28,773 | 7,578.30 | 3.7 |
| Greater Edmundston | 21,903 | 22,471 | 916.85 | 23.9 |
| Greater Campbellton | 17,842 | 17,878 | 1,629.94 | 10.9 |
Cities and towns
| Town | Population (2011) | Population Ranking | Land Area km² | Area Ranking | Density /km² | Density Ranking |
|---|---|---|---|---|---|---|
| Bathurst | 12,275 | 9 | 91.86 | 6 | 133.6 | 24 |
| Beresford | 4,351 | 20 | 19.20 | 17 | 226.6 | 18 |
| Bouctouche | 2,423 | 26 | 18.34 | 19 | 132.1 | 25 |
| Campbellton | 7,385 | 12 | 18.66 | 18 | 395.7 | 9 |
| Caraquet | 4,169 | 23 | 68.26 | 8 | 61.1 | 35 |
| Dalhousie | 3,512 | 24 | 14.51 | 23 | 242.1 | 17 |
| Dieppe | 23,310 | 4 | 54.11 | 11 | 430.8 | 6 |
| Edmundston | 16,032 | 8 | 107.00 | 5 | 149.8 | 23 |
| Florenceville-Bristol | 1,639 | 29 | 15.61 | 22 | 105.0 | 29 |
| Fredericton | 56,224 | 3 | 131.67 | 4 | 427.0 | 7 |
| Grand Bay–Westfield | 5,117 | 17 | 59.86 | 9 | 85.5 | 33 |
| Grand Falls | 5,706 | 14 | 18.05 | 20 | 315.9 | 13 |
| Hampton | 4,292 | 22 | 21.00 | 16 | 204.3 | 21 |
| Hartland | 947 | 35 | 9.63 | 30 | 98.4 | 31 |
| Lamèque | 1,432 | 31 | 12.45 | 28 | 115.1 | 27 |
| Miramichi | 17,811 | 7 | 179.93 | 2 | 99.0 | 30 |
| McAdam | 1,404 | 32 | 14.47 | 24 | 97.02 | 32 |
| Moncton | 69,074 | 2 | 141.17 | 3 | 489.3 | 2 |
| Nackawic | 1,049 | 34 | 8.40 | 32 | 124.9 | 26 |
| Oromocto | 8,932 | 11 | 22.37 | 15 | 399.2 | 8 |
| Quispamsis | 17,886 | 6 | 57.06 | 10 | 313.5 | 14 |
| Richibucto | 1,286 | 33 | 11.83 | 27 | 108.7 | 28 |
| Riverview | 19,128 | 5 | 33.88 | 13 | 564.6 | 1 |
| Rothesay | 11,947 | 10 | 34.77 | 12 | 343.6 | 12 |
| Sackville | 5,558 | 15 | 74.32 | 7 | 74.8 | 34 |
| Saint Andrews | 1,889 | 28 | 8.35 | 33 | 226.2 | 19 |
| Saint John | 70,063 | 1 | 315.82 | 1 | 221.8 | 20 |
| Saint-Léonard | 1,343 | 32 | 5.20 | 34 | 258.3 | 16 |
| Saint-Quentin | 2,095 | 27 | 4.30 | 35 | 486.7 | 3 |
| Shediac | 6,053 | 13 | 12.50 | 26 | 484.4 | 4 |
| Shippagan | 2,603 | 25 | 9.94 | 29 | 261.9 | 15 |
| St. George | 1,543 | 30 | 16.13 | 21 | 95.6 | 32 |
| St. Stephen | 4,817 | 19 | 13.45 | 24 | 358.0 | 11 |
| Sussex | 4,312 | 21 | 9.03 | 31 | 477.4 | 5 |
| Tracadie–Sheila | 4,933 | 18 | 24.65 | 14 | 200.1 | 22 |
| Woodstock | 5,254 | 16 | 13.41 | 25 | 391.7 | 10 |
Population of New Brunswick since 1851
| Year | Population | Five Year % change |
Ten Year % change |
Rank Among Provinces |
|---|---|---|---|---|
| 1851 | 193,800 | n/a | n/a | 4 |
| 1861 | 252,047 | n/a | 30.0 | 4 |
| 1871 | 285,594 | n/a | 13.3 | 4 |
| 1881 | 321,233 | n/a | 12.5 | 4 |
| 1891 | 321,263 | n/a | 0.0 | 4 |
| 1901 | 331,120 | n/a | 3.1 | 4 |
| 1911 | 351,889 | n/a | 6.3 | 8 |
| 1921 | 387,876 | n/a | 10.2 | 8 |
| 1931 | 408,219 | n/a | 5.2 | 8 |
| 1941 | 457,401 | n/a | 12.0 | 8 |
| 1951 | 515,697 | n/a | 12.7 | 8 |
| 1956 | 554,616 | 7.5 | n/a | 8 |
| 1961 | 597,936 | 7.8 | 15.9 | 8 |
| 1966 | 616,788 | 3.2 | 11.2 | 8 |
| 1971 | 634,560 | 2.9 | 6.9 | 8 |
| 1976 | 677,250 | 6.7 | 9.8 | 8 |
| 1981 | 696,403 | 2.8 | 9.7 | 8 |
| 1986 | 709,445 | 1.9 | 4.8 | 8 |
| 1991 | 723,900 | 2.0 | 3.9 | 8 |
| 1996 | 738,133 | 2.0 | 4.0 | 8 |
| 2001 | 729,498 | -1.2 | 0.8 | 8 |
| 2006 | 729,997 | 0.1 | -1.1 | 8 |
| 2011 | 751,171 | 2.9 | 3.0 | 8 |
Source: Statistics Canada [1][2]
Ethnic origin
| Ethnic Origin | Population | Percent |
|---|---|---|
| Canadian / Canadien | 415,810 | 57.78% |
| French | 193,470 | 26.8% |
| English | 165,235 | 22.96% |
| Irish | 135,835 | 18.87% |
| Scottish | 127,635 | 17.73% |
| German | 27,490 | 3.82% |
| Acadian | 26,220 | 3.64% |
| North American Indian | 23,815 | 3.31% |
| Dutch (Netherlands) | 13,355 | 1.86% |
| Welsh | 7,620 | 1.06% |
| Italian | 5,610 | 0.78% |
| Métis | 4,955 | 0.69% |
| American (USA) | 3,925 | 0.55% |
| Danish | 3,390 | 0.47% |
The information at the left is from Statistics Canada [3]
Percentages add to more than 100% because of dual responses e.g. "Danish-Canadian" generates an entry in both the category "Danish" and the category "Canadian". Groups with more than 3,000 responses are included.
Visible minorities and Aboriginals
| Visible minority and Aboriginal population (Canada 2006 Census) | |||
|---|---|---|---|
| Population group | Population | % of total population | |
| White | 688,655 | 95.7% | |
| Visible minority group Source:[4] | South Asian | 1,960 | 0.3% |
| Chinese | 2,450 | 0.3% | |
| Black | 4,455 | 0.6% | |
| Filipino | 530 | 0.1% | |
| Latin American | 720 | 0.1% | |
| Arab | 840 | 0.1% | |
| Southeast Asian | 445 | 0.1% | |
| West Asian | 550 | 0.1% | |
| Korean | 625 | 0.1% | |
| Japanese | 170 | 0% | |
| Visible minority, n.i.e. | 150 | 0% | |
| Multiple visible minority | 455 | 0.1% | |
| Total visible minority population | 13,345 | 1.9% | |
| Aboriginal group Source:[5] | First Nations | 12,385 | 1.7% |
| Métis | 4,270 | 0.6% | |
| Inuit | 185 | 0% | |
| Aboriginal, n.i.e. | 710 | 0.1% | |
| Multiple Aboriginal identity | 100 | 0% | |
| Total Aboriginal population | 17,650 | 2.5% | |
| Total population | 719,650 | 100% | |
Languages

The 2011 Canadian census showed a population of 751,171. Of the 731,855 singular responses to the question concerning mother tongue the most commonly reported languages were:
| Ranking | Language | Population | Percentage |
|---|---|---|---|
| 1. | English | 479,930 | 65.58% |
| 2. | French | 233,530 | 31.90% |
| 3. | Algonquian languages | 2,125 | 0.29% |
| Mi'kmaq | 2,115 | 0.29% | |
| Cree language | 10 | 0.001% | |
| 4. | Chinese | 1,825 | 0.25% |
| Mandarin | 405 | 0.06% | |
| Cantonese | 225 | 0.03% | |
| Taiwanese | 5 | 0.001% | |
| 5. | Korean | 1,810 | 0.25% |
| 6. | German | 1,805 | 0.25% |
| 7. | Arabic | 1,325 | 0.18% |
| 8. | Spanish | 1,135 | 0.16% |
| 9. | Dutch (Nederlands) | 925 | 0.13% |
| 10. | Tagalog (Pilipino/Filipino) | 585 | 0.08% |
| 11. | Hindustani | 455 | 0.06% |
| Hindi | 250 | 0.03% | |
| Urdu | 205 | 0.03% | |
| 12. | Persian | 450 | 0.06% |
| 13. | Italian | 440 | 0.06% |
| 14. | Romanian | 420 | 0.06% |
| 15. | Russian | 355 | 0.05% |
| 16. | Vietnamese | 285 | 0.04% |
| 17. | Serbo-Croatian languages | 280 | 0.04% |
| Serbian | 120 | 0.02% | |
| Croatian | 75 | 0.01% | |
| Bosnian | 40 | 0.01% | |
| 18. | Polish | 255 | 0.03% |
| 19. | Scandinavian languages | 235 | 0.03% |
| Danish | 145 | 0.01% | |
| Norwegian | 45 | 0.01% | |
| Swedish | 45 | 0.01% | |
| 20. | Portuguese | 220 | 0.03% |
| 21. | Bantu languages | 200 | 0.03% |
| Swahili | 140 | 0.02% | |
| 22. | Bengali | 180 | 0.02% |
| 23. | Hungarian (Magyar) | 155 | 0.02% |
| 24. | Greek | 140 | 0.02% |
Note: "n.i.e.": not included elsewhere
There were also 45 single-language responses for Gujarati; 135 for Niger-Congo languages n.i.e.; 70 for Creole; 95 for Non-verbal languages (Sign languages); 115 for Japanese; 30 for Indo-Iranian languages n.i.e.; 5 for Somali; 20 for Sinhala (Sinhalese); and 40 for Malayalam. New Brunswick's official languages are shown in bold. (Figures shown are for the number of single language responses and the percentage of total single-language responses.)[6]
Migration
Immigration
The 2006 Canadian census counted a total of 28,395 immigrants living in New Brunswick.
The most commonly reported origins for these immigrants were:
[7]
| 1. | United States | 8,660 |
| 2. | United Kingdom | 5,205 |
| 3. | Germany | 1,770 |
| 4. | Netherlands | 995 |
| 5. | China | 925 |
| 6. | India | 600 |
| 7. | Italy | 405 |
| 8. | South Korea | 370 |
| 9. | former Yugoslavia | 355 |
| 10. | Philippines | 350 |
| 11. | France | 320 |
| 12. | Iran | 265 |
| 13. | Lebanon | 220 |
| 14. | Pakistan | 205 |
There were also 195 immigrants from the Democratic Republic of Congo; 180 from Vietnam; 170 from Colombia; 165 each from Hungary and Romania; 155 each from Belgium and El Salvador; 140 each from Greece and Ireland (Éire); 125 from Poland; 120 each from Afghanistan and South Africa; 115 from Ukraine; 110 from Guyana; 105 each from Denmark and from Trinidad and Tobago; and 100 from Austria.
Internal migration
A total of 64,205 people moved to New Brunswick from other parts of Canada between 1996 and 2006 while 83,240 people moved in the opposite direction. These movements resulted in a net outmigration of 8,410 people to Alberta, 4,330 to Ontario, 2,930 to Nova Scotia, and 1,995 to Quebec. During this period there was a net outmigration of 2,125 francophones to Quebec, 1,460 francophones going to Ontario, 1,355 to Alberta and 145 to Nova Scotia; and also a net influx of 240 anglophones from Quebec. (All net inter-provincial movements of more than 500 persons and official minority movements of more than 100 persons are given.)[8][9]
Religion
| 2001 | 20111 | |||||
|---|---|---|---|---|---|---|
| Number | % | Number | % | |||
| Total Population | 719,715 | 100 | 735,835 | 100 | ||
| Christian | 647,295 | 89.9 | 616,910 | 83.8 | ||
| - Total Catholic2 | 386,035 | 53.6 | 366,155 | 49.8 | ||
| - Total Protestant | 260,695 | 36.2 | 249,820 | 34.0 | ||
| - Baptist | 80,490 | 11.2 | 70,990 | 9.6 | ||
| - United Church of Canada | 69,235 | 9.6 | 54,270 | 7.4 | ||
| - Anglican Church of Canada | 58,210 | 8.1 | 51,365 | 7.0 | ||
| - Pentecostal | 20,150 | 2.8 | 18,435 | 2.5 | ||
| - Protestant, Other3 | 24,200 | 2.6 | 45,910 | 6.2 | ||
| - Presbyterian | 6,900 | 1.0 | 7,770 | 1.1 | ||
| - Lutheran | 1,510 | 0.2 | 1080 | 0.1 | ||
| - Christian Orthodox4 | 565 | 0.1 | 980 | 0.1 | ||
| No Religious Affiliation | 56,440 | 7.8 | 111,435 | 15.1 | ||
| Other | 5,295 | 0.7 | 7,495 | 1.0 | ||
| - Muslim | 1,275 | 0.2 | 2,640 | 0.4 | ||
| - Other Religions5 | 1,970 | 0.3 | 1,915 | 0.3 | ||
| - Jewish | 670 | 0.1 | 620 | 0.1 | ||
| - Buddhist | 545 | 0.1 | 975 | 0.1 | ||
| - Hindu | 475 | 0.1 | 820 | 0.1 | ||
| - Aboriginal Spirituality | 360 | 0.1 | 525 | 0.1 | ||
|
1 The 2011 data is from the National Household Survey[11] and so numbers are estimates. | ||||||
See also
References
- ↑ Population urban and rural, by province and territory (New Brunswick). Statistics Canada, 2005.
- ↑ Canada's population. Statistics Canada. Last accessed September 28, 2006.
- ↑ Ethnic Origin (232), Sex (3) and Single and Multiple Responses (3) (2001 Census)
- ↑ Brunswick&SearchType=Begins&SearchPR=01&B1=All&Custom=, Community Profiles from the 2006 Census, Statistics Canada - Province/Territory
- ↑ Brunswick&SearchType=Begins&SearchPR=01&B1=All&Custom=, Aboriginal Population Profile from the 2006 Census, Statistics Canada - Province/Territory
- ↑ Detailed Mother Tongue (186), Knowledge of Official Languages (5), Age Groups (17A) and Sex (3) (2011 Census)
- ↑ Immigrant Status and Period of Immigration (8) and Place of Birth (261) (2006 Census)
- ↑ Province or Territory of Residence 5 Years Ago (14), Mother Tongue (8), Age Groups (16) and Sex (3) (2006 Census)
- ↑ Province or Territory of Residence 5 Years Ago (14), Mother Tongue (8), Age Groups (16) and Sex (3) (2001 census)
- ↑ "96F0030XIE2001015 - Religions in Canada". 2.statcan.ca. Retrieved 2014-05-17.
- 1 2 "NHSNewBrunswick2011". 2.statcan.ca. Retrieved 2014-05-17.
| Subdivisions | |
|---|---|
| Cities | |
| |
| Provinces | |
|---|---|
| Territories | |
| |
| Ethnic ancestry |
| ||||||||||||||||||||||||||||||||||||||||||||||||||||||||||||||||||||||||
|---|---|---|---|---|---|---|---|---|---|---|---|---|---|---|---|---|---|---|---|---|---|---|---|---|---|---|---|---|---|---|---|---|---|---|---|---|---|---|---|---|---|---|---|---|---|---|---|---|---|---|---|---|---|---|---|---|---|---|---|---|---|---|---|---|---|---|---|---|---|---|---|---|---|
| Demographics | |||||||||||||||||||||||||||||||||||||||||||||||||||||||||||||||||||||||||
| Culture & society | |||||||||||||||||||||||||||||||||||||||||||||||||||||||||||||||||||||||||
| List of Canadians |
| ||||||||||||||||||||||||||||||||||||||||||||||||||||||||||||||||||||||||
| |||||||||||||||||||||||||||||||||||||||||||||||||||||||||||||||||||||||||