Jackson County, Kentucky
| Jackson County, Kentucky | |
|---|---|
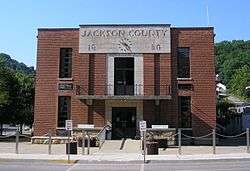 Jackson County courthouse in McKee | |
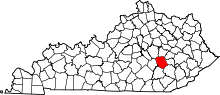 Location in the U.S. state of Kentucky | |
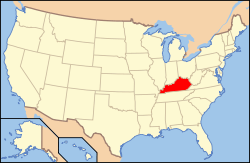 Kentucky's location in the U.S. | |
| Founded | 1858 |
| Named for | Andrew Jackson |
| Seat | McKee |
| Largest community | Annville |
| Area | |
| • Total | 347 sq mi (899 km2) |
| • Land | 345 sq mi (894 km2) |
| • Water | 1.3 sq mi (3 km2), 0.4% |
| Population | |
| • (2010) | 13,494 |
| • Density | 39/sq mi (15/km²) |
| Congressional district | 5th |
| Time zone | Eastern: UTC-5/-4 |
| Website |
www |
Jackson County is a county located in the Commonwealth of Kentucky. As of the 2010 census, the population was 13,494.[1] Its county seat is McKee.[2] The county was formed in 1858 from land given by Madison, Estill, Owsley, Clay, Laurel, and Rockastle counties.[3] It was named for Andrew Jackson, seventh President of the United States.[4][5] It is a prohibition or dry county.
Jackson County is home to the Daniel Boone National Forest.
Geography
According to the U.S. Census Bureau, the county has a total area of 347 square miles (900 km2), of which 345 square miles (890 km2) is land and 1.3 square miles (3.4 km2) (0.4%) is water.[6]
Adjacent counties
- Estill County (north)
- Lee County (northeast)
- Owsley County (east)
- Clay County (southeast)
- Laurel County (southwest)
- Rockcastle County (west)
- Madison County (northwest)
National protected area
- Daniel Boone National Forest (part)
Demographics
| Historical population | |||
|---|---|---|---|
| Census | Pop. | %± | |
| 1860 | 3,087 | — | |
| 1870 | 4,547 | 47.3% | |
| 1880 | 6,678 | 46.9% | |
| 1890 | 8,261 | 23.7% | |
| 1900 | 10,561 | 27.8% | |
| 1910 | 10,734 | 1.6% | |
| 1920 | 11,687 | 8.9% | |
| 1930 | 10,467 | −10.4% | |
| 1940 | 16,339 | 56.1% | |
| 1950 | 13,101 | −19.8% | |
| 1960 | 10,677 | −18.5% | |
| 1970 | 10,005 | −6.3% | |
| 1980 | 11,996 | 19.9% | |
| 1990 | 11,955 | −0.3% | |
| 2000 | 13,495 | 12.9% | |
| 2010 | 13,494 | 0.0% | |
| Est. 2015 | 13,352 | [7] | −1.1% |
| U.S. Decennial Census[8] 1790-1960[9] 1900-1990[10] 1990-2000[11] 2010-2013[1] | |||
As of the census[12] of 2000, there were 13,495 people, 5,307 households, and 3,953 families residing in the county. The population density was 39 per square mile (15/km2). There were 6,065 housing units at an average density of 18 per square mile (6.9/km2). The racial makeup of the county was 99.17% White, 0.05% Black or African American, 0.19% Native American, 0.01% Asian, 0.01% Pacific Islander, 0.04% from other races, and 0.52% from two or more races. 0.53% of the population were Hispanic or Latino of any race.
There were 5,307 households out of which 35.50% had children under the age of 18 living with them, 60.20% were married couples living together, 10.30% had a female householder with no husband present, and 25.50% were non-families. 23.00% of all households were made up of individuals and 9.30% had someone living alone who was 65 years of age or older. The average household size was 2.52 and the average family size was 2.96.
In the county the population was spread out with 26.10% under the age of 18, 9.80% from 18 to 24, 29.40% from 25 to 44, 22.90% from 45 to 64, and 11.80% who were 65 years of age or older. The median age was 35 years. For every 100 females there were 97.30 males. For every 100 females age 18 and over, there were 95.20 males.
The median income for a household in the county was $20,177, and the median income for a family was $23,638. Males had a median income of $25,087 versus $16,065 for females. The per capita income for the county was $10,711. About 25.80% of families and 30.20% of the population were below the poverty line, including 36.50% of those under age 18 and 24.10% of those age 65 or over.
Education
Elementary Schools: McKee Elementary, Sand Gap Elementary, and Tyner Elementary (Grades Preschool through 5) Tyner Elementary is the most populated elementary school in the county.
Middle Schools: Jackson County Middle School (Grades 6 through 8)
High Schools: Jackson County High School (Grades 9 through 12)
Private Institutions: Annville Christian Academy (up to grade 8), Outreach Christian Academy (up to grade 12)
Politics
In Presidential elections Jackson County has been strongly Republican for decades. In 1940 Wendell Willkie received over 88% of the county's vote.[13] The county gave the Republican candidate the highest percentage in the 1928, 1948,[14] 1960,[15] 1976,[16] and 1988 Presidential elections.[17] Overall Republicans have won by solid margins in every election of the last 53 years.[18][19] Since 1992 the Republican Presidential candidate has consistently received at least 70% of the county's vote.[20]
Jackson County is part of Kentucky's 5th congressional district, which has a Cook Partisan Voting Index of R+16 and is represented by Republican Hal Rogers. In the Kentucky House of Representatives it is in the 89th District and has been represented by Republican Marie L. Rader since 1997. In the Kentucky Senate it is in the 21st District and was represented by Republican Tom Jensen until he retired in 2012. In the 2012 election, Albert Robinson was elected to represent the 21st District. Robinson is a London, KY businessman.[21]
| Year | Republican | Democrat |
|---|---|---|
| 2016 | 88.87% 4,889 | 8.76% 482 |
| 2012 | 86.25% 4,365 | 12.09% 612 |
| 2008 | 84.36% 4,407 | 14.22% 743 |
| 2004 | 84.38% 4,369 | 14.85% 769 |
| 2000 | 84.02% 4,079 | 14.44% 701 |
Communities
Famous residents
- David "Stringbean" Akeman, country music star who was born and raised in Annville
- Freddie Langdon, world champion fiddler
- Andrew N. Johnson, Prohibition Party's 1944 nominee for vice president of the United States
- Bill Miner, train robber
See also
References
- 1 2 "State & County QuickFacts". United States Census Bureau. Retrieved March 8, 2014.
- ↑ "Find a County". National Association of Counties. Archived from the original on May 31, 2011. Retrieved 2011-06-07.
- ↑ Rennick, Robert M. (1987). Kentucky Place Names. University Press of Kentucky. p. 151. Retrieved 2013-07-26.
- ↑ The Register of the Kentucky State Historical Society, Volume 1. Kentucky State Historical Society. 1903. p. 35.
- ↑ Gannett, Henry (1905). The Origin of Certain Place Names in the United States. Govt. Print. Off. p. 167.
- ↑ "2010 Census Gazetteer Files". United States Census Bureau. August 22, 2012. Retrieved August 16, 2014.
- ↑ "County Totals Dataset: Population, Population Change and Estimated Components of Population Change: April 1, 2010 to July 1, 2015". Retrieved July 2, 2016.
- ↑ "U.S. Decennial Census". United States Census Bureau. Archived from the original on May 11, 2015. Retrieved August 16, 2014.
- ↑ "Historical Census Browser". University of Virginia Library. Retrieved August 16, 2014.
- ↑ "Population of Counties by Decennial Census: 1900 to 1990". United States Census Bureau. Retrieved August 16, 2014.
- ↑ "Census 2000 PHC-T-4. Ranking Tables for Counties: 1990 and 2000" (PDF). United States Census Bureau. Retrieved August 16, 2014.
- ↑ "American FactFinder". United States Census Bureau. Archived from the original on September 11, 2013. Retrieved 2008-01-31.
- ↑ "David Leip's Presidential Election Atlas – 1940 statistics". Uselectionatlas.org. Retrieved November 13, 2011.
- ↑ "David Leip's Presidential Election Atlas – 1948 statistics". Uselectionatlas.org. Retrieved November 13, 2011.
- ↑ "David Leip's Presidential Election Atlas – 1960 statistics". Uselectionatlas.org. Retrieved November 13, 2011.
- ↑ "David Leip's Presidential Election Atlas – 1976 statistics". Uselectionatlas.org. Retrieved November 13, 2011.
- ↑ "David Leip's Presidential Election Atlas – 1988 statistics". Uselectionatlas.org. Retrieved November 13, 2011.
- ↑ "David Leip's Presidential Election Atlas – 1956". Uselectionatlas.org. Retrieved November 13, 2011.
- ↑ "David Leip Presidential Atlas (Election maps for Kentucky)". Uselectionatlas.org. Retrieved November 13, 2011.
- ↑ "The New York Times Electoral Map (Zoom in on Kentucky)". Elections.nytimes.com. December 9, 2008. Retrieved November 13, 2011.
- ↑ "Kentucky Legislators by county at the Kentucky government site". Lrc.ky.gov. Retrieved November 13, 2011.
- ↑ "Dave Leip's Atlas of U.S. Presidential Elections". Retrieved 2016-05-08.
External links
Municipalities and communities of Jackson County, Kentucky, United States | ||
|---|---|---|
| City | | |
| CDP | ||
| Unincorporated communities | ||

Coordinates: 37°25′N 84°01′W / 37.42°N 84.01°W