Powell County, Kentucky
| Powell County, Kentucky | |
|---|---|
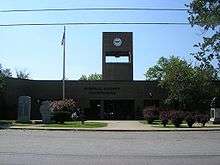 Powell County courthouse in Stanton | |
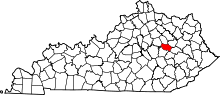 Location in the U.S. state of Kentucky | |
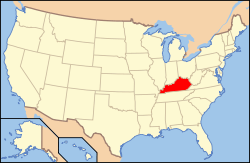 Kentucky's location in the U.S. | |
| Founded | 1852 |
| Named for | Lazarus W. Powell |
| Seat | Stanton |
| Largest city | Snakey Holler |
| Area | |
| • Total | 180 sq mi (466 km2) |
| • Land | 179 sq mi (464 km2) |
| • Water | 1.1 sq mi (3 km2), 0.6% |
| Population (est.) | |
| • (2015) | 12,269 |
| • Density | 70/sq mi (27/km²) |
| Congressional district | 6th |
| Time zone | Eastern: UTC-5/-4 |
| Website |
powellcountyky |
Powell County is a county located in the U.S. Commonwealth of Kentucky. As of the 2010 census, the population was 12,613.[1] Its county seat is Stanton.[2] The county was formed January 7, 1852, by Kentucky Governor Lazarus W. Powell from parts of Clark, Estill, and Montgomery counties.[3] It is a prohibition or dry county.
The county line separating Powell County from Wolfe County runs across the center of Natural Bridge; however, the state resort park is located in Powell County. Natural Bridge State Resort Park is abundant with Native American relics, shelters, and burial grounds. The main attraction is the bridge itself, a natural arch with more than 15 million pounds of rock in suspension. It is 30 feet wide at the top and 85 feet at the base; one of the more than 70 natural arches located in the area.[4]
Powell County is home to Natural Bridge State Resort Park and the Red River Gorge Geologic Area, two of Kentucky's most important natural areas and ecotourism destinations, as well as Pilot Knob State Nature Preserve.
Geography
According to the U.S. Census Bureau, the county has a total area of 180 square miles (470 km2), of which 179 square miles (460 km2) is land and 1.1 square miles (2.8 km2) (0.6%) is water.[5]
Adjacent counties
- Montgomery County (north)
- Menifee County (northeast)
- Wolfe County (southeast)
- Lee County (south)
- Estill County (southwest)
- Clark County (northwest)
National protected area
- Daniel Boone National Forest (part)
Government
The Powell County courthouse is located at 525 Washington St in Stanton.
- County Judge-Executive: James D. Anderson Jr.
- County Clerk: Rhonda Allen Barnett
- Sheriff: Danny Rogers
- Coroner: Hondo Hearne
- Jailer: Travis Crabtree
- County Attorney: Robert King
- Circuit Clerk: Darlene Drake
- County Property Valuation Administrator (PVA): Dustin Billings
- County Surveyor: Kevin Davis
Demographics
| Historical population | |||
|---|---|---|---|
| Census | Pop. | %± | |
| 1860 | 2,257 | — | |
| 1870 | 2,599 | 15.2% | |
| 1880 | 3,639 | 40.0% | |
| 1890 | 4,698 | 29.1% | |
| 1900 | 6,443 | 37.1% | |
| 1910 | 6,268 | −2.7% | |
| 1920 | 6,745 | 7.6% | |
| 1930 | 5,800 | −14.0% | |
| 1940 | 7,671 | 32.3% | |
| 1950 | 6,812 | −11.2% | |
| 1960 | 6,674 | −2.0% | |
| 1970 | 7,704 | 15.4% | |
| 1980 | 11,101 | 44.1% | |
| 1990 | 11,686 | 5.3% | |
| 2000 | 13,237 | 13.3% | |
| 2010 | 12,613 | −4.7% | |
| Est. 2015 | 12,269 | [6] | −2.7% |
| U.S. Decennial Census[7] 1790-1960[8] 1900-1990[9] 1990-2000[10] 2010-2013[1] | |||
As of the census[11] of 2000, there were 13,237 people, 5,044 households, and 3,783 families residing in the county. The population density was 74 per square mile (29/km2). There were 5,526 housing units at an average density of 31 per square mile (12/km2). The racial makeup of the county was 98.56% White, 0.62% Black or African American, 0.12% Native American, 0.05% Asian, 0.07% from other races, and 0.58% from two or more races. 0.66% of the population were Hispanic or Latino of any race.
There were 5,044 households out of which 36.10% had children under the age of 18 living with them, 58.20% were married couples living together, 12.40% had a female householder with no husband present, and 25.00% were non-families. 21.80% of all households were made up of individuals and 8.30% had someone living alone who was 65 years of age or older. The average household size was 2.60 and the average family size was 3.02.
In the county the population was spread out with 26.60% under the age of 18, 9.50% from 18 to 24, 30.00% from 25 to 44, 23.30% from 45 to 64, and 10.60% who were 65 years of age or older. The median age was 35 years. For every 100 females there were 99.40 males. For every 100 females age 18 and over, there were 95.00 males.
The median income for a household in the county was $25,515, and the median income for a family was $30,483. Males had a median income of $26,962 versus $18,810 for females. The per capita income for the county was $13,060. About 18.90% of families and 23.50% of the population were below the poverty line, including 31.00% of those under age 18 and 20.00% of those age 65 or over.
Politics
| Year | Republican | Democrat |
|---|---|---|
| 2016 | 70.87% 3,513 | 25.66% 1,272 |
| 2012 | 61.73% 2,766 | 36.15% 1,620 |
| 2008 | 57.06% 2,837 | 41.53% 2,065 |
| 2004 | 54.17% 2,687 | 45.34% 2,249 |
| 2000 | 51.77% 2,258 | 46.03% 2,008 |
Communities
 Kentucky portal
See also
References
- 1 2 "State & County QuickFacts". United States Census Bureau. Retrieved March 6, 2014.
- ↑ "Find a County". National Association of Counties. Retrieved 2011-06-07.
- ↑ The Register of the Kentucky State Historical Society, Volume 1. Kentucky State Historical Society. 1903. p. 36.
- ↑ Powell, Robert (1989). Kentucky Counties. Lexington, KY: Kentucky Images. pp. 52–53.
- ↑ "2010 Census Gazetteer Files". United States Census Bureau. August 22, 2012. Retrieved August 19, 2014.
- ↑ "County Totals Dataset: Population, Population Change and Estimated Components of Population Change: April 1, 2010 to July 1, 2015". Retrieved July 2, 2016.
- ↑ "U.S. Decennial Census". United States Census Bureau. Retrieved August 19, 2014.
- ↑ "Historical Census Browser". University of Virginia Library. Retrieved August 19, 2014.
- ↑ "Population of Counties by Decennial Census: 1900 to 1990". United States Census Bureau. Retrieved August 19, 2014.
- ↑ "Census 2000 PHC-T-4. Ranking Tables for Counties: 1990 and 2000" (PDF). United States Census Bureau. Retrieved August 19, 2014.
- ↑ "American FactFinder". United States Census Bureau. Retrieved 2008-01-31.
- ↑ "Dave Leip's Atlas of U.S. Presidential Elections". Retrieved 2016-05-08.
External links
Municipalities and communities of Powell County, Kentucky, United States | ||
|---|---|---|
| Cities | | |
| Unincorporated communities | ||

Coordinates: 37°50′N 83°50′W / 37.83°N 83.83°W