Lee County, Kentucky
| Lee County, Kentucky | |
|---|---|
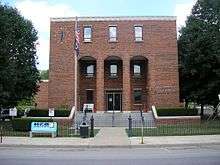 Lee County courthouse in Beattyville | |
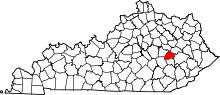 Location in the U.S. state of Kentucky | |
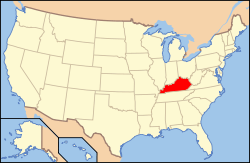 Kentucky's location in the U.S. | |
| Founded | 1870 |
| Named for | Robert E. Lee |
| Seat | Beattyville |
| Largest city | Beattyville |
| Area | |
| • Total | 211 sq mi (546 km2) |
| • Land | 209 sq mi (541 km2) |
| • Water | 2.4 sq mi (6 km2), 1.1% |
| Population | |
| • (2010) | 7,887 |
| • Density | 38/sq mi (15/km²) |
| Congressional district | 5th |
| Time zone | Eastern: UTC-5/-4 |
| Website |
www |
Lee County is a county located in the U.S. state of Kentucky. As of the 2010 census, the population was 7,887.[1] Its county seat is Beattyville.[2] The county was formed in 1870 from parts of Breathitt, Estill, Owsley and Wolfe counties.[3] The county was named for Confederate general Robert E. Lee.[4]
The town of Proctor, named for the Reverend Joseph Proctor, was the first county seat.[3] The first court was held on April 25, 1870 in the Old Howerton House. The local economy at the time included coal mining, salt gathering, timber operations, and various commercial operations. It featured a post office from 1843 until 1918.
The current county seat, Beattyville, was first known as Taylor's Landing.[3] It was renamed to Beatty in 1850 after early settler Samuel Beatty. The town incorporated in 1872 as Beattyville and became the new county seat due to its location along the Kentucky River.
Although Lee County contained taverns in the 19th century,[5] it is currently a prohibition or dry county.
Geography
According to the U.S. Census Bureau, the county has a total area of 211 square miles (550 km2), of which 209 square miles (540 km2) is land and 2.4 square miles (6.2 km2) (1.1%) is water.[6]
Eastern Mountain Coal Fields
Lee County lies within the Eastern Mountain Coal Fields region of Kentucky. The very rugged terrain greatly defines the area. Roughly half of the county lies within the Daniel Boone National Forest. Timber and coal remain economically significant. Harmful effects from strip mining and clear cut logging are still being corrected. The proliferation of kudzu has proved difficult to address. However, with the growing environmental movement and the developing tourism industry more action is being taken.
Adjacent counties
- Powell County (north)
- Wolfe County (northeast)
- Breathitt County (southeast)
- Owsley County (south)
- Jackson County (southwest)
- Estill County (northwest)
National protected area
- Daniel Boone National Forest (part)
Demographics
| Historical population | |||
|---|---|---|---|
| Census | Pop. | %± | |
| 1880 | 4,254 | — | |
| 1890 | 6,205 | 45.9% | |
| 1900 | 7,988 | 28.7% | |
| 1910 | 9,531 | 19.3% | |
| 1920 | 11,918 | 25.0% | |
| 1930 | 9,729 | −18.4% | |
| 1940 | 10,860 | 11.6% | |
| 1950 | 8,739 | −19.5% | |
| 1960 | 7,420 | −15.1% | |
| 1970 | 6,587 | −11.2% | |
| 1980 | 7,754 | 17.7% | |
| 1990 | 7,422 | −4.3% | |
| 2000 | 7,916 | 6.7% | |
| 2010 | 7,887 | −0.4% | |
| Est. 2015 | 6,752 | [7] | −14.4% |
| U.S. Decennial Census[8] 1790-1960[9] 1900-1990[10] 1990-2000[11] 2010-2013[1] | |||
As of the census[12] of 2000, there were 7,916 people, 2,985 households, and 2,122 families residing in the county. The population density was 38 per square mile (15/km2). There were 3,321 housing units at an average density of 16 per square mile (6.2/km2). The racial makeup of the county was 95.10% White, 3.79% Black or African American, 0.28% Native American, 0.10% Asian, 0.01% Pacific Islander, 0.06% from other races, and 0.66% from two or more races. 0.37% of the population were Hispanic or Latino of any race.
There were 2,985 households out of which 32.60% had children under the age of 18 living with them, 54.80% were married couples living together, 12.80% had a female householder with no husband present, and 28.90% were non-families. 26.60% of all households were made up of individuals and 11.80% had someone living alone who was 65 years of age or older. The average household size was 2.41 and the average family size was 2.91.
In the county the population was spread out with 22.70% under the age of 18, 9.00% from 18 to 24, 30.30% from 25 to 44, 23.60% from 45 to 64, and 14.30% who were 65 years of age or older. The median age was 37 years. For every 100 females there were 109.40 males. For every 100 females age 18 and over, there were 111.80 males.
The median income for a household in the county was $18,544, and the median income for a family was $24,918. Males had a median income of $25,930 versus $19,038 for females. The per capita income for the county was $13,325. About 25.20% of families and 30.40% of the population were below the poverty line, including 41.00% of those under age 18 and 22.90% of those age 65 or over.
Life expectancy
Of 3,143 counties in the United States in 2013, Lee County ranked 3,111 for the life expectancy of males and 2,989 for longevity of females. Males in Lee County lived an average of 68.5 years and females lived an average of 76.7 years compared to the national average for life expectancy of 76.5 for males and 81.2 for females. Moreover, the average life expectancy in Lee Country was stable for males and declined by 1.5 years for females between 1985 and 2013 compared to a national average for the same period of an increased life span of 5.5 years for men and 3.1 years for women. High rates of smoking and obesity and a low level of physical activity appear to be contributing factors to the low life expectancy for both sexes.[13]
Politics
| Year | Republican | Democrat |
|---|---|---|
| 2016 | 80.65% 2,151 | 16.65% 444 |
| 2012 | 75.37% 1,977 | 22.68% 595 |
| 2008 | 71.33% 1,978 | 27.12% 752 |
| 2004 | 69.11% 2,018 | 30.07% 878 |
| 2000 | 68.49% 1,893 | 30.25% 836 |
Economy
Lee County, Kentucky is often listed as one of the poorest counties in the United States. In 2014, 35 percent of its population lived in poverty and the median family income was $23,968 compared to 14.8 percent poor and a $53,482 median family income for the United States as a whole.[15]
Communities
City
- Beattyville (county seat)
Unincorporated communities
- Airedale
- Athol
- Belle Point
- Canyon Falls
- Congleton
- Cressmont
- Crystal
- Delvinta
- Earnestville
- Enoch
- Evelyn
- Fillmore
- Fincastle
- Fixer
- Greeley
- Heidelberg
- Idamay
- Leeco
- Lower Buffalo
- Maloney
- Monica
- Mount Olive
- Old Landing
- Primrose
- Proctor
- Saint Helens
- Standing Rock
- Tallega
- White Ash
- Williba
- Willow Shoals
- Yellow Rock
- Zacharia
- Zoe
See also
References
- 1 2 "State & County QuickFacts". United States Census Bureau. Retrieved March 6, 2014.
- ↑ "Find a County". National Association of Counties. Retrieved 2011-06-07.
- 1 2 3 Kendrick, Debi (January 3, 2014). "Lee County Kentucky Genealogy". USGenNet.
- ↑ The Register of the Kentucky State Historical Society, Volume 1. Kentucky State Historical Society. 1903. p. 36.
- ↑ Collins, Lewis (1877). History of Kentucky. p. 461.
- ↑ "2010 Census Gazetteer Files". United States Census Bureau. August 22, 2012. Retrieved August 17, 2014.
- ↑ "County Totals Dataset: Population, Population Change and Estimated Components of Population Change: April 1, 2010 to July 1, 2015". Retrieved July 2, 2016.
- ↑ "U.S. Decennial Census". United States Census Bureau. Retrieved August 17, 2014.
- ↑ "Historical Census Browser". University of Virginia Library. Retrieved August 17, 2014.
- ↑ "Population of Counties by Decennial Census: 1900 to 1990". United States Census Bureau. Retrieved August 17, 2014.
- ↑ "Census 2000 PHC-T-4. Ranking Tables for Counties: 1990 and 2000" (PDF). United States Census Bureau. Retrieved August 17, 2014.
- ↑ "American FactFinder". United States Census Bureau. Retrieved 2008-01-31.
- ↑ "Lee County, Kentucky", http://www.healthdata.org/sites/default/files/files/county_profiles/US/County_Report_Lee_County_Kentucky.pdf, accessed 12 Oct 2016
- ↑ "Dave Leip's Atlas of U.S. Presidential Elections". Retrieved 2016-04-28.
- ↑ "Lee County, Kentucky," http://www.census.gov/quickfacts/table/PST045213/21129/embed/accessible; "United States" https://www.census.gov/quickfacts/table/INC110214/00, accessed 6 Aug 2016
Municipalities and communities of Lee County, Kentucky, United States | ||
|---|---|---|
| City | | |
| Unincorporated communities |
| |
Coordinates: 37°35′N 83°43′W / 37.59°N 83.72°W