Clay County, Kentucky
| Clay County, Kentucky | |
|---|---|
 Clay County courthouse in Manchester | |
 Location in the U.S. state of Kentucky | |
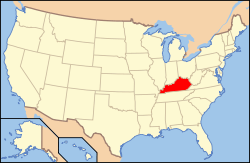 Kentucky's location in the U.S. | |
| Founded | 1807 |
| Named for | Green Clay |
| Seat | Manchester |
| Largest city | Manchester |
| Area | |
| • Total | 471 sq mi (1,220 km2) |
| • Land | 469 sq mi (1,215 km2) |
| • Water | 1.8 sq mi (5 km2), 0.4% |
| Population | |
| • (2010) | 21,730 |
| • Density | 46/sq mi (18/km²) |
| Congressional district | 5th |
| Time zone | Eastern: UTC-5/-4 |
| Website |
claycounty |
Clay County is a county located in the U.S. state of Kentucky. As of the 2010 census, the population was 21,730.[1] Its county seat is Manchester.[2] The county was formed in 1807 and named in honor of Green Clay (1757–1826).[3] Clay was a member of the Virginia and Kentucky State legislatures, first cousin once removed of Henry Clay, U.S. Senator from Kentucky and Secretary of State in the 19th century.
History
Clay County was established in 1807 from land given by Floyd, Knox and Madison counties. The courthouse burned in January 1936.[4]
In the United States elections, 2010, Clay County had voting fraud as described by the New York Times in 2016:
In Clay County, Ky., eight local election officials were convicted in 2010 of fooling voters who used "iVotronic" election machines, which resemble A.T.M.s. After casting their ballots, the voters pressed a big red button on a screen marked "Vote." But some of the machines then required the voter to touch another button, "Confirm Vote."The officials were accused of trying to hide this last fact from voters, having them leave the booth as soon as they touched "Vote." When they left, the officials would review and sometimes change the votes, then confirm the selection.
The fraud left no paper trail and preyed on voters unfamiliar with the machines. But it also required hands-on tinkering with the actual machines. And since the machines are offline, that could not be done en masse, or from afar.[5]
Geography
According to the U.S. Census Bureau, the county has a total area of 471 square miles (1,220 km2), of which 469 square miles (1,210 km2) is land and 1.8 square miles (4.7 km2) (0.4%) is water.[6]
Adjacent counties
- Owsley County (north)
- Perry County (northeast)
- Leslie County (east)
- Bell County (southeast)
- Knox County (southwest)
- Laurel County (west)
- Jackson County (northwest)
Demographics
| Historical population | |||
|---|---|---|---|
| Census | Pop. | %± | |
| 1810 | 2,398 | — | |
| 1820 | 4,393 | 83.2% | |
| 1830 | 3,548 | −19.2% | |
| 1840 | 4,607 | 29.8% | |
| 1850 | 5,421 | 17.7% | |
| 1860 | 6,652 | 22.7% | |
| 1870 | 8,297 | 24.7% | |
| 1880 | 10,222 | 23.2% | |
| 1890 | 12,447 | 21.8% | |
| 1900 | 15,364 | 23.4% | |
| 1910 | 17,789 | 15.8% | |
| 1920 | 19,795 | 11.3% | |
| 1930 | 18,526 | −6.4% | |
| 1940 | 23,901 | 29.0% | |
| 1950 | 23,116 | −3.3% | |
| 1960 | 20,748 | −10.2% | |
| 1970 | 18,481 | −10.9% | |
| 1980 | 22,752 | 23.1% | |
| 1990 | 21,746 | −4.4% | |
| 2000 | 24,556 | 12.9% | |
| 2010 | 21,730 | −11.5% | |
| Est. 2015 | 21,013 | [7] | −3.3% |
| U.S. Decennial Census[8] 1790-1960[9] 1900-1990[10] 1990-2000[11] 2010-2013[1] | |||
As of the census[12] of 2010, there were 21,730 people, 8,556 households, and 6,442 families residing in the county. The population density was 52 people per square mile (20/km²). There were 9,439 housing units at an average density of 20 per square mile (8/km²). The racial makeup of the county was 93.92% White, 4.80% Black or African American, 0.21% Native American, 0.12% Asian, 0.02% Pacific Islander, 0.23% from other races, and 0.71% from two or more races. 1.36% of the population were Hispanics or Latinos of any race.
There were 8,556 households out of which 36.90% had children under the age of 18 living with them, 58.60% were married couples living together, 12.40% had a female householder with no husband present, and 24.70% were non-families. 22.50% of all households were made up of individuals and 9.00% had someone living alone who was 65 years of age or older. The average household size was 2.62 and the average family size was 3.06.
The age distribution was 25.40% under the age of 18, 9.20% from 18 to 24, 32.60% from 25 to 44, 22.50% from 45 to 64, and 10.30% who were 65 years of age or older. The median age was 35 years. For every 100 females there were 111.70 males. For every 100 females age 18 and over, there were 112.60 males.
The median income for a household in the county was $16,271, and the median income for a family was $18,925. Males had a median income of $24,164 versus $17,816 for females. The per capita income for the county was $9,716. About 35.40% of families and 39.70% of the population were below the poverty line, including 47.60% of those under age 18 and 31.30% of those age 65 or over. The county's per-capita income and median household income make it one of the poorest counties in the United States. Among counties whose population contains a non-Hispanic white majority, it is the poorest by per-capita income and second to another county in the same Kentucky region, Owsley County, by median household income.
Politics
Clay County has been solidly Republican since the Civil War, having last voted for a Democratic nominee for president in 1860.[13] In the last 16 years the only Republican to receive less than 60% was Bob Dole, who still won the county by nearly 25%. In 2008 John McCain received 77.5% of the vote.[14]
| Year | Republican | Democrat |
|---|---|---|
| 2012 | 83.65% 6,176 | 15.05% 1,111 |
| 2008 | 77.54% 5,710 | 21.08% 1,552 |
| 2004 | 74.49% 5,726 | 24.73% 1,901 |
| 2000 | 73.31% 4,926 | 25.64% 1,723 |
Health
In July 2010 the Washington Post named Clay County the unhealthiest county in Kentucky, and one of the unhealthiest in the nation, The county has a high obesity rate. Clay County also featured prominently in a June 2014 NY Times article about the difficulty of living in poverty in Eastern Kentucky, ranking last in their overall ratings for counties in the United States.[16]
Communities
- Benge
- Burning Springs
- Fogertown
- Goose Rock
- Larue
- Manchester (county seat)
- Oneida
- Hector
- Garrad
- Fall Rock
- Beech Creek
- Greenbriar
- Little Goose
See also
References
- 1 2 "State & County QuickFacts". United States Census Bureau. Retrieved March 6, 2014.
- ↑ "Find a County". National Association of Counties. Archived from the original on 2011-05-31. Retrieved 2011-06-07.
- ↑ Rennick, Robert M. (1987). Kentucky Place Names. University Press of Kentucky. p. 59. Retrieved 2013-04-28.
- ↑ Hogan, Roseann Reinemuth (1992). Kentucky Ancestry: A Guide to Genealogical and Historical Research. Ancestry Publishing. p. 218. Retrieved 26 July 2013.
- ↑ David E. Sanger and Charlie Savage (September 14, 2016). "Sowing Doubt Is Seen as Prime Danger in Hacking Voting System". NYT. Retrieved September 15, 2016.
- ↑ "2010 Census Gazetteer Files". United States Census Bureau. August 22, 2012. Retrieved August 13, 2014.
- ↑ "County Totals Dataset: Population, Population Change and Estimated Components of Population Change: April 1, 2010 to July 1, 2015". Retrieved July 2, 2016.
- ↑ "U.S. Decennial Census". United States Census Bureau. Archived from the original on May 11, 2015. Retrieved August 13, 2014.
- ↑ "Historical Census Browser". University of Virginia Library. Retrieved August 13, 2014.
- ↑ "Population of Counties by Decennial Census: 1900 to 1990". United States Census Bureau. Retrieved August 13, 2014.
- ↑ "Census 2000 PHC-T-4. Ranking Tables for Counties: 1990 and 2000" (PDF). United States Census Bureau. Retrieved August 13, 2014.
- ↑ "American FactFinder". United States Census Bureau. Archived from the original on 2013-09-11. Retrieved 2008-01-31.
- ↑ "David Leip Presidential Atlas (Election maps for Kentucky)". Uselectionatlas.org. Retrieved 2012-09-03.
- ↑ "The New York Times Electoral Map (Zoom in on Kentucky)". Elections.nytimes.com. 2008-12-09. Retrieved 2012-09-03.
- ↑ "Dave Leip's Atlas of U.S. Presidential Elections". Retrieved 2016-05-08.
- ↑ Lowrey, Annie (2014-06-29). "What's the Matter With Eastern Kentucky?". NYtimes.com.
Further reading
- Estep, Bill (November 30, 2013). "50 Years of Night: A drug-addled city hits bottom, strives to get clean". Lexington Herald-Leader. Lexington: The McClatchy Company.
- Estep, Bill (November 30, 2013). "Decades of poverty and vote-buying led to widespread corruption in Clay County". Lexington Herald-Leader. Lexington: The McClatchy Company.
External links
 |
Jackson County | Owsley County | Perry County | |
| Laurel County | |
Leslie County | ||
| ||||
| | ||||
| Knox County | Bell County |
Municipalities and communities of Clay County, Kentucky, United States | ||
|---|---|---|
| City | | |
| CDP | ||
| Other unincorporated communities | ||

Coordinates: 37°10′N 83°43′W / 37.16°N 83.71°W