Morgan County, Kentucky
| Morgan County, Kentucky | |
|---|---|
 Morgan County, courthouse in West Liberty | |
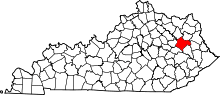 Location in the U.S. state of Kentucky | |
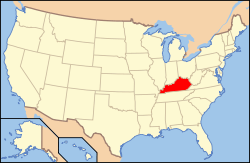 Kentucky's location in the U.S. | |
| Founded | 1822 |
| Named for | Daniel Morgan |
| Seat | West Liberty |
| Largest city | West Liberty |
| Area | |
| • Total | 384 sq mi (995 km2) |
| • Land | 381 sq mi (987 km2) |
| • Water | 2.7 sq mi (7 km2), 0.7% |
| Population | |
| • (2010) | 13,923 |
| • Density | 37/sq mi (14/km²) |
| Congressional district | 5th |
| Time zone | Eastern: UTC-5/-4 |
| Website |
morgancounty |
Morgan County is a county located in the U.S. state of Kentucky. As of the 2010 census, the population was 13,923.[1] Its county seat is West Liberty.[2] The county is among the dry counties, which means that the sale of alcohol is restricted or prohibited.
History
Morgan County was formed on December 7, 1822 from portions of Bath County and Floyd County.[3] It was named for Daniel Morgan, a distinguished general in the American Revolutionary War.[4]
The history of Christian churches in the county was documented in A History of the Churches of Christ in Morgan County Kentucky, a thesis by Luke Bolin in 1941, which included pictures of churches and group pictures of people associated with the churches.
Morgan County was hit by an EF3 tornado on March 2, 2012, which cost the lives of six people and injured many others. Following the tornado, Morgan County's population decreased, but the county seat still has a strong population for a small town.
Morgan County had begun building a new court house in 2011, but the tornado delayed its construction to late 2013.
Geography
According to the U.S. Census Bureau, the county has a total area of 384 square miles (990 km2), of which 300 square miles (780 km2) is land and 2.7 square miles (7.0 km2) (0.7%) is water.[5]
Adjacent counties
- Rowan County (northwest)
- Elliott County (north)
- Lawrence County (northeast)
- Johnson County (east)
- Magoffin County (southeast)
- Wolfe County (southwest)
- Menifee County (west)
National protected area
- Daniel Boone National Forest (part)
Demographics
| Historical population | |||
|---|---|---|---|
| Census | Pop. | %± | |
| 1830 | 2,857 | — | |
| 1840 | 4,603 | 61.1% | |
| 1850 | 7,620 | 65.5% | |
| 1860 | 9,237 | 21.2% | |
| 1870 | 5,975 | −35.3% | |
| 1880 | 8,455 | 41.5% | |
| 1890 | 11,249 | 33.0% | |
| 1900 | 12,792 | 13.7% | |
| 1910 | 16,259 | 27.1% | |
| 1920 | 16,518 | 1.6% | |
| 1930 | 15,130 | −8.4% | |
| 1940 | 16,827 | 11.2% | |
| 1950 | 13,624 | −19.0% | |
| 1960 | 11,056 | −18.8% | |
| 1970 | 10,019 | −9.4% | |
| 1980 | 12,103 | 20.8% | |
| 1990 | 11,648 | −3.8% | |
| 2000 | 13,948 | 19.7% | |
| 2010 | 13,923 | −0.2% | |
| Est. 2015 | 13,275 | [6] | −4.7% |
| U.S. Decennial Census[7] 1790-1960[8] 1900-1990[9] 1990-2000[10] 2010-2013[1] | |||
As of the census[11] of 2000, there were 13,948 people, 4,752 households, and 3,568 families residing in the county. The population density was 37 per square mile (14/km2). There were 5,487 housing units at an average density of 14 per square mile (5.4/km2). The racial makeup of the county was 94.59% White, 4.38% Black or African American, 0.15% Native American, 0.16% Asian, 0.01% Pacific Islander, 0.06% from other races, and 0.65% from two or more races. 0.61% of the population were Hispanic or Latino of any race.
There were 4,752 households out of which 34.80% had children under the age of 18 living with them, 62.40% were married couples living together, 9.20% had a female householder with no husband present, and 24.90% were non-families. 22.60% of all households were made up of individuals and 10.30% had someone living alone who was 65 years of age or older. The average household size was 2.55 and the average family size was 2.97.
In the county the population was spread out with 22.40% under the age of 18, 10.60% from 18 to 24, 32.90% from 25 to 44, 22.30% from 45 to 64, and 11.80% who were 65 years of age or older. The median age was 36 years. For every 100 females there were 123.30 males. For every 100 females age 18 and over, there were 128.40 males.
The median income for a household in the county was $21,869, and the median income for a family was $26,135. Males had a median income of $23,966 versus $18,463 for females. The per capita income for the county was $12,657. 27.20% of the population and 23.50% of families were below the poverty line. Out of the total people living in poverty, 33.90% are under the age of 18 and 28.50% are 65 or older.
| Year | Democratic | Republican |
|---|---|---|
| 2016 | 21.1% 1,006 | 76.1% 3,628 |
| 2012 | 30.6% 1,369 | 67.6% 3,021 |
| 2008 | 42.9% 1,879 | 54.7% 2,396 |
| 2004 | 48.0% 2,532 | 50.9% 2,682 |
| 2000 | 44.2% 1,875 | 54.1% 2,295 |
| 1996 | 49.9% 1,843 | 38.9% 1,439 |
| 1992 | 60.2% 2,655 | 28.1% 1,239 |
| 1988 | 61.0% 2,329 | 38.0% 1,452 |
| 1984 | 57.3% 2,481 | 42.4% 1,834 |
| 1980 | 64.3% 2,698 | 34.5% 1,450 |
| 1976 | 74.3% 2,897 | 25.0% 973 |
| 1972 | 53.9% 1,815 | 45.6% 1,535 |
| 1968 | 56.1% 2,222 | 33.9% 1,341 |
| 1964 | 84.7% 3,293 | 14.0% 546 |
| 1960 | 62.9% 2,910 | 37.1% 1,718 |
Communities
See also
References
- 1 2 "State & County QuickFacts". United States Census Bureau. Retrieved March 6, 2014.
- ↑ "Find a County". National Association of Counties. Retrieved 2011-06-07.
- ↑ "Morgan County". The Kentucky Encyclopedia. 2000. Retrieved August 23, 2014.
- ↑ The Register of the Kentucky State Historical Society, Volume 1. Kentucky State Historical Society. 1903. p. 36.
- ↑ "2010 Census Gazetteer Files". United States Census Bureau. August 22, 2012. Retrieved August 18, 2014.
- ↑ "County Totals Dataset: Population, Population Change and Estimated Components of Population Change: April 1, 2010 to July 1, 2015". Retrieved July 2, 2016.
- ↑ "U.S. Decennial Census". United States Census Bureau. Retrieved August 18, 2014.
- ↑ "Historical Census Browser". University of Virginia Library. Retrieved August 18, 2014.
- ↑ "Population of Counties by Decennial Census: 1900 to 1990". United States Census Bureau. Retrieved August 18, 2014.
- ↑ "Census 2000 PHC-T-4. Ranking Tables for Counties: 1990 and 2000" (PDF). United States Census Bureau. Retrieved August 18, 2014.
- ↑ "American FactFinder". United States Census Bureau. Retrieved 2008-01-31.
- ↑ "Dave Leip's Atlas of U.S. Presidential Elections". Retrieved November 29, 2012.
External links
- County Background and History
- Morgan County Schools
- The Kentucky Highlands Project
- Morgan History & Ancestry
Municipalities and communities of Morgan County, Kentucky, United States | ||
|---|---|---|
| City | | |
| CDP | ||
| Other unincorporated communities | ||
Coordinates: 37°55′N 83°16′W / 37.92°N 83.26°W