Magoffin County, Kentucky
| Magoffin County, Kentucky | |
|---|---|
 Magoffin County justice center in Salyersville | |
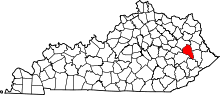 Location in the U.S. state of Kentucky | |
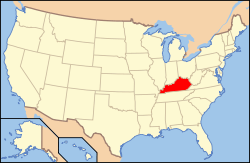 Kentucky's location in the U.S. | |
| Founded | 1860 |
| Named for | Beriah Magoffin |
| Seat | Salyersville |
| Largest city | Salyersville |
| Area | |
| • Total | 309 sq mi (800 km2) |
| • Land | 308 sq mi (798 km2) |
| • Water | 0.7 sq mi (2 km2), 0.2% |
| Population | |
| • (2010) | 13,333 |
| • Density | 43/sq mi (17/km²) |
| Congressional district | 5th |
| Time zone | Eastern: UTC-5/-4 |
| Website |
magoffincounty |
Magoffin County is a county located in the U.S. state of Kentucky. As of the 2010 census, the population was 13,333.[1] Its county seat is Salyersville.[2] The county was formed in 1860 from Floyd, Johnson, and Morgan Counties and named for Beriah Magoffin who was Governor of Kentucky (1859–62).[3][4]
Geography
According to the U.S. Census Bureau, the county has a total area of 309 square miles (800 km2), of which 308 square miles (800 km2) is land and 0.7 square miles (1.8 km2) (0.2%) is water.[5] It is watered by Licking River.[6]
Adjacent counties
- Morgan County (northwest)
- Johnson County (northeast)
- Floyd County (southeast)
- Knott County (south)
- Breathitt County (southwest)
- Wolfe County (west)
Demographics
| Historical population | |||
|---|---|---|---|
| Census | Pop. | %± | |
| 1870 | 4,684 | — | |
| 1880 | 6,944 | 48.2% | |
| 1890 | 9,196 | 32.4% | |
| 1900 | 12,006 | 30.6% | |
| 1910 | 13,654 | 13.7% | |
| 1920 | 13,859 | 1.5% | |
| 1930 | 15,719 | 13.4% | |
| 1940 | 17,490 | 11.3% | |
| 1950 | 13,839 | −20.9% | |
| 1960 | 11,156 | −19.4% | |
| 1970 | 10,443 | −6.4% | |
| 1980 | 13,515 | 29.4% | |
| 1990 | 13,077 | −3.2% | |
| 2000 | 13,332 | 1.9% | |
| 2010 | 13,333 | 0.0% | |
| Est. 2015 | 12,808 | [7] | −3.9% |
| U.S. Decennial Census[8] 1790-1960[9] 1900-1990[10] 1990-2000[11] 2010-2013[1] | |||
As of the 2010 United States Census, there were 13,333 people residing in the county. 98.6% were White, 0.3% Native American, 0.1% Black or African American, 0.1% Asian, 0.2% of some other race and 0.7% of two or more races. 0.7% were Hispanic or Latino (of any race).
As of the census[12] of 2000, there were 13,332 people, 5,024 households, and 3,858 families residing in the county. The population density was 43 per square mile (17/km2). There were 5,447 housing units at an average density of 18 per square mile (6.9/km2). The racial makeup of the county was 99.29% White, 0.15% Black or African American, 0.20% Native American, 0.08% Asian, 0.02% from other races, and 0.27% from two or more races. 0.42% of the population were Hispanic or Latino of any race. There is a significant Melungeon or Black-Dutch population in Magoffin County, known locally as the "Brown People of Magoffin County". In a 2007 study by the U.S. Census Bureau, Magoffin County, along with Mitchell County in Iowa, was cited as the U.S. county having the largest percentage of individuals in the demographic category of "Non-Hispanic white alone."[13]
There were 5,024 households out of which 37.50% had children under the age of 18 living with them, 61.90% were married couples living together, 11.20% had a female householder with no husband present, and 23.20% were non-families. 21.40% of all households were made up of individuals and 8.20% had someone living alone who was 65 years of age or older. The average household size was 2.62 and the average family size was 3.04.
In the county the population was spread out with 26.80% under the age of 18, 10.10% from 18 to 24, 30.20% from 25 to 44, 22.40% from 45 to 64, and 10.60% who were 65 years of age or older. The median age was 34 years. For every 100 females there were 97.20 males. For every 100 females age 18 and over, there were 94.40 males.
The median income for a household in the county was $19,421, and the median income for a family was $24,031. Males had a median income of $27,745 versus $18,354 for females. The per capita income for the county was $10,685. About 31.20% of families and 36.60% of the population were below the poverty line, including 45.90% of those under age 18 and 29.10% of those age 65 or over.
Politics
| Year | Republican | Democrat |
|---|---|---|
| 2016 | 74.75% 3,824 | 22.91% 1,172 |
| 2012 | 69.12% 3,391 | 29.21% 1,433 |
| 2008 | 52.33% 2,434 | 45.26% 2,105 |
| 2004 | 49.60% 2,836 | 49.72% 2,843 |
| 2000 | 51.07% 2,785 | 47.74% 2,603 |
Economy
The last active coal mine in Magoffin County closed in 2015.[15]
Communities
Notable residents
- Jimmy Flynt, Co-Founder of Hustler magazine
- Larry Flynt, publisher of Hustler magazine
- Rebecca Lynn Howard, country music singer
- Buell Kazee, folk singer, banjo player and minister
- Chris Bailey, Chief Meteorologist at WKYT in Lexington, KY
- Jim Caldwell, Meteorologist at WKYT in Lexington, KY
See also
- Big Sandy Area Development District
- National Register of Historic Places listings in Magoffin County, Kentucky
References
- 1 2 "State & County QuickFacts". United States Census Bureau. Retrieved March 6, 2014.
- ↑ "Find a County". National Association of Counties. Retrieved 2011-06-07.
- ↑ E., Kleber, John; Kentucky, University Press of; Policy, Institute for Regional Analysis and Public; Library, Camden-Carroll; University, Morehead State (1 January 2000). "The Kentucky Encyclopedia".
- ↑ The Register of the Kentucky State Historical Society, Volume 1. Kentucky State Historical Society. 1903. p. 36.
- ↑ "2010 Census Gazetteer Files". United States Census Bureau. August 22, 2012. Retrieved August 17, 2014.
- ↑
 Ripley, George; Dana, Charles A., eds. (1879). "Magoffin". The American Cyclopædia.
- ↑ "County Totals Dataset: Population, Population Change and Estimated Components of Population Change: April 1, 2010 to July 1, 2015". Retrieved July 2, 2016.
- ↑ "U.S. Decennial Census". United States Census Bureau. Retrieved August 17, 2014.
- ↑ "Historical Census Browser". University of Virginia Library. Retrieved August 17, 2014.
- ↑ "Population of Counties by Decennial Census: 1900 to 1990". United States Census Bureau. Retrieved August 17, 2014.
- ↑ "Census 2000 PHC-T-4. Ranking Tables for Counties: 1990 and 2000" (PDF). United States Census Bureau. Retrieved August 17, 2014.
- ↑ "American FactFinder". United States Census Bureau. Retrieved 2008-01-31.
- ↑ "Minority Population is Booming Nationally and in Utah - Science News". redOrbit. 2007-08-09. Retrieved 2012-03-06.
- ↑ "Dave Leip's Atlas of U.S. Presidential Elections". Retrieved 2016-04-26.
- ↑ "Top 10 of 2015 - Salyersville Independent".
External links
- Magoffin County Schools
- The Magoffin County Historical Society
- Sandy Valley Transportation Services, Inc.
- Magoffin History & Ancestry
Municipalities and communities of Magoffin County, Kentucky, United States | ||
|---|---|---|
| City | | |
| Unincorporated communities | ||

Coordinates: 37°42′N 83°04′W / 37.70°N 83.06°W